
One Year of Calorie Counting : Lessons and Results
Quick Links:
- Motivations
- Key Positive (+) : Measurable Progress Over Time
- Key Negative (-) : Health Became a Game
- Key Positive (+) : Calories Become Currency
- Key Negative (-) : Overaccountability
- Conclusions
- Data Collection Notes
Motivations
One year ago, I was a few months into my first full-time job, was still learning how to be a functional human being, and was one pound shy of having an obese BMI. Something needed to be done.
So, I started tracking my calories in, calories out, and weight each day just as a way to keep track of how I was doing health wise. The initial goal was just to see if lowering my net calories had any effect on my weight over time. While this is one of the questions I was able to answer, this journey of counting calories became about a lot more in the past year.
I wanted to talk about the biggest positives I’ve experienced from tracking my health as well as the biggest downsides I faced in this experience. Hopefully this helps you to decide whether or not health tracking is a good fit for you!
Key Positive (+) : Measurable Progress Over Time
The definite biggest positive from my health tracking was that it gave me the ability to visually track my progress over time and see if any changes I was making (positive or negative) were having any effects on my health. Since my primary objective in the beginning was to lose weight, that’s the story I wanted to talk about here.
While your rate of weight loss will depend on several other factors like genetics and activity level, the usual idea is that the lower you keep your net calories, the more weight you can lose. Let’s take a look at my net calories over time first.
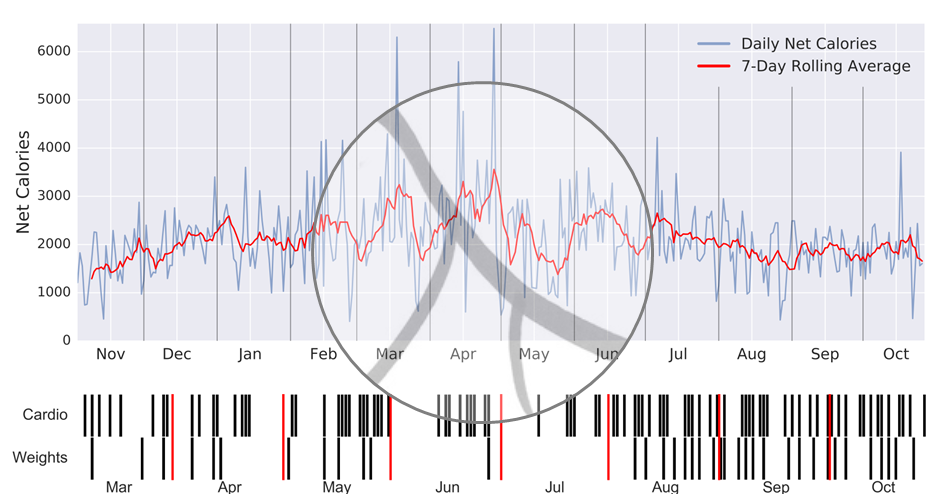
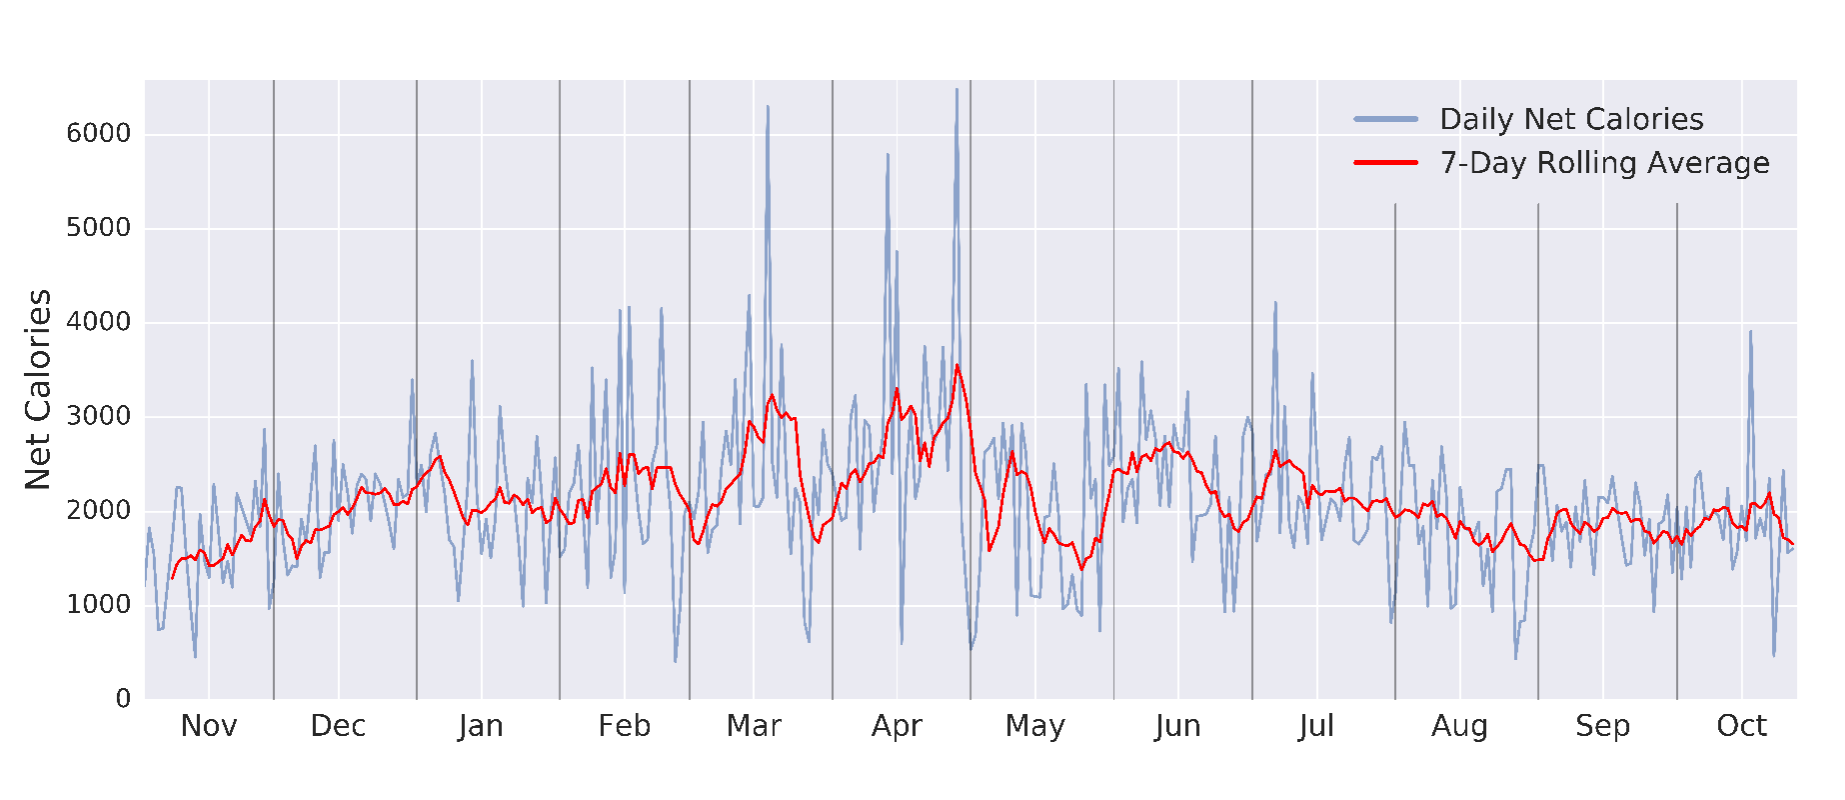
Net Calories Over Time
-
While the raw data (in blue) is pretty noisy, once we take a rolling average (in red), the true trend becomes more apparent. My net calories had been steadily increasing since I started collecting data, eventually spiking at the end of April with around 3500 net calories per day (Yikes!)
-
Honestly, at that point I remember consistently feeling tired and heavy all the time and realized that if I wanted to reduce my net calories I either needed to increase my calories out or decrease my calories in. The issue was clearly with my calories in (I was eating way too much), so I made a conscious effort to consume fewer calories
-
After that point, my net calories dipped towards the end of May and have since stabilized to just under 2000
-
An additional interesting point is that my net calorie volatility (how wild the blue graph is) has been reducing since the volatility peaked in April, meaning that I found myself with a more consistent caloric schedule between one day and the next
Taking a look now at my weight in the same time period:
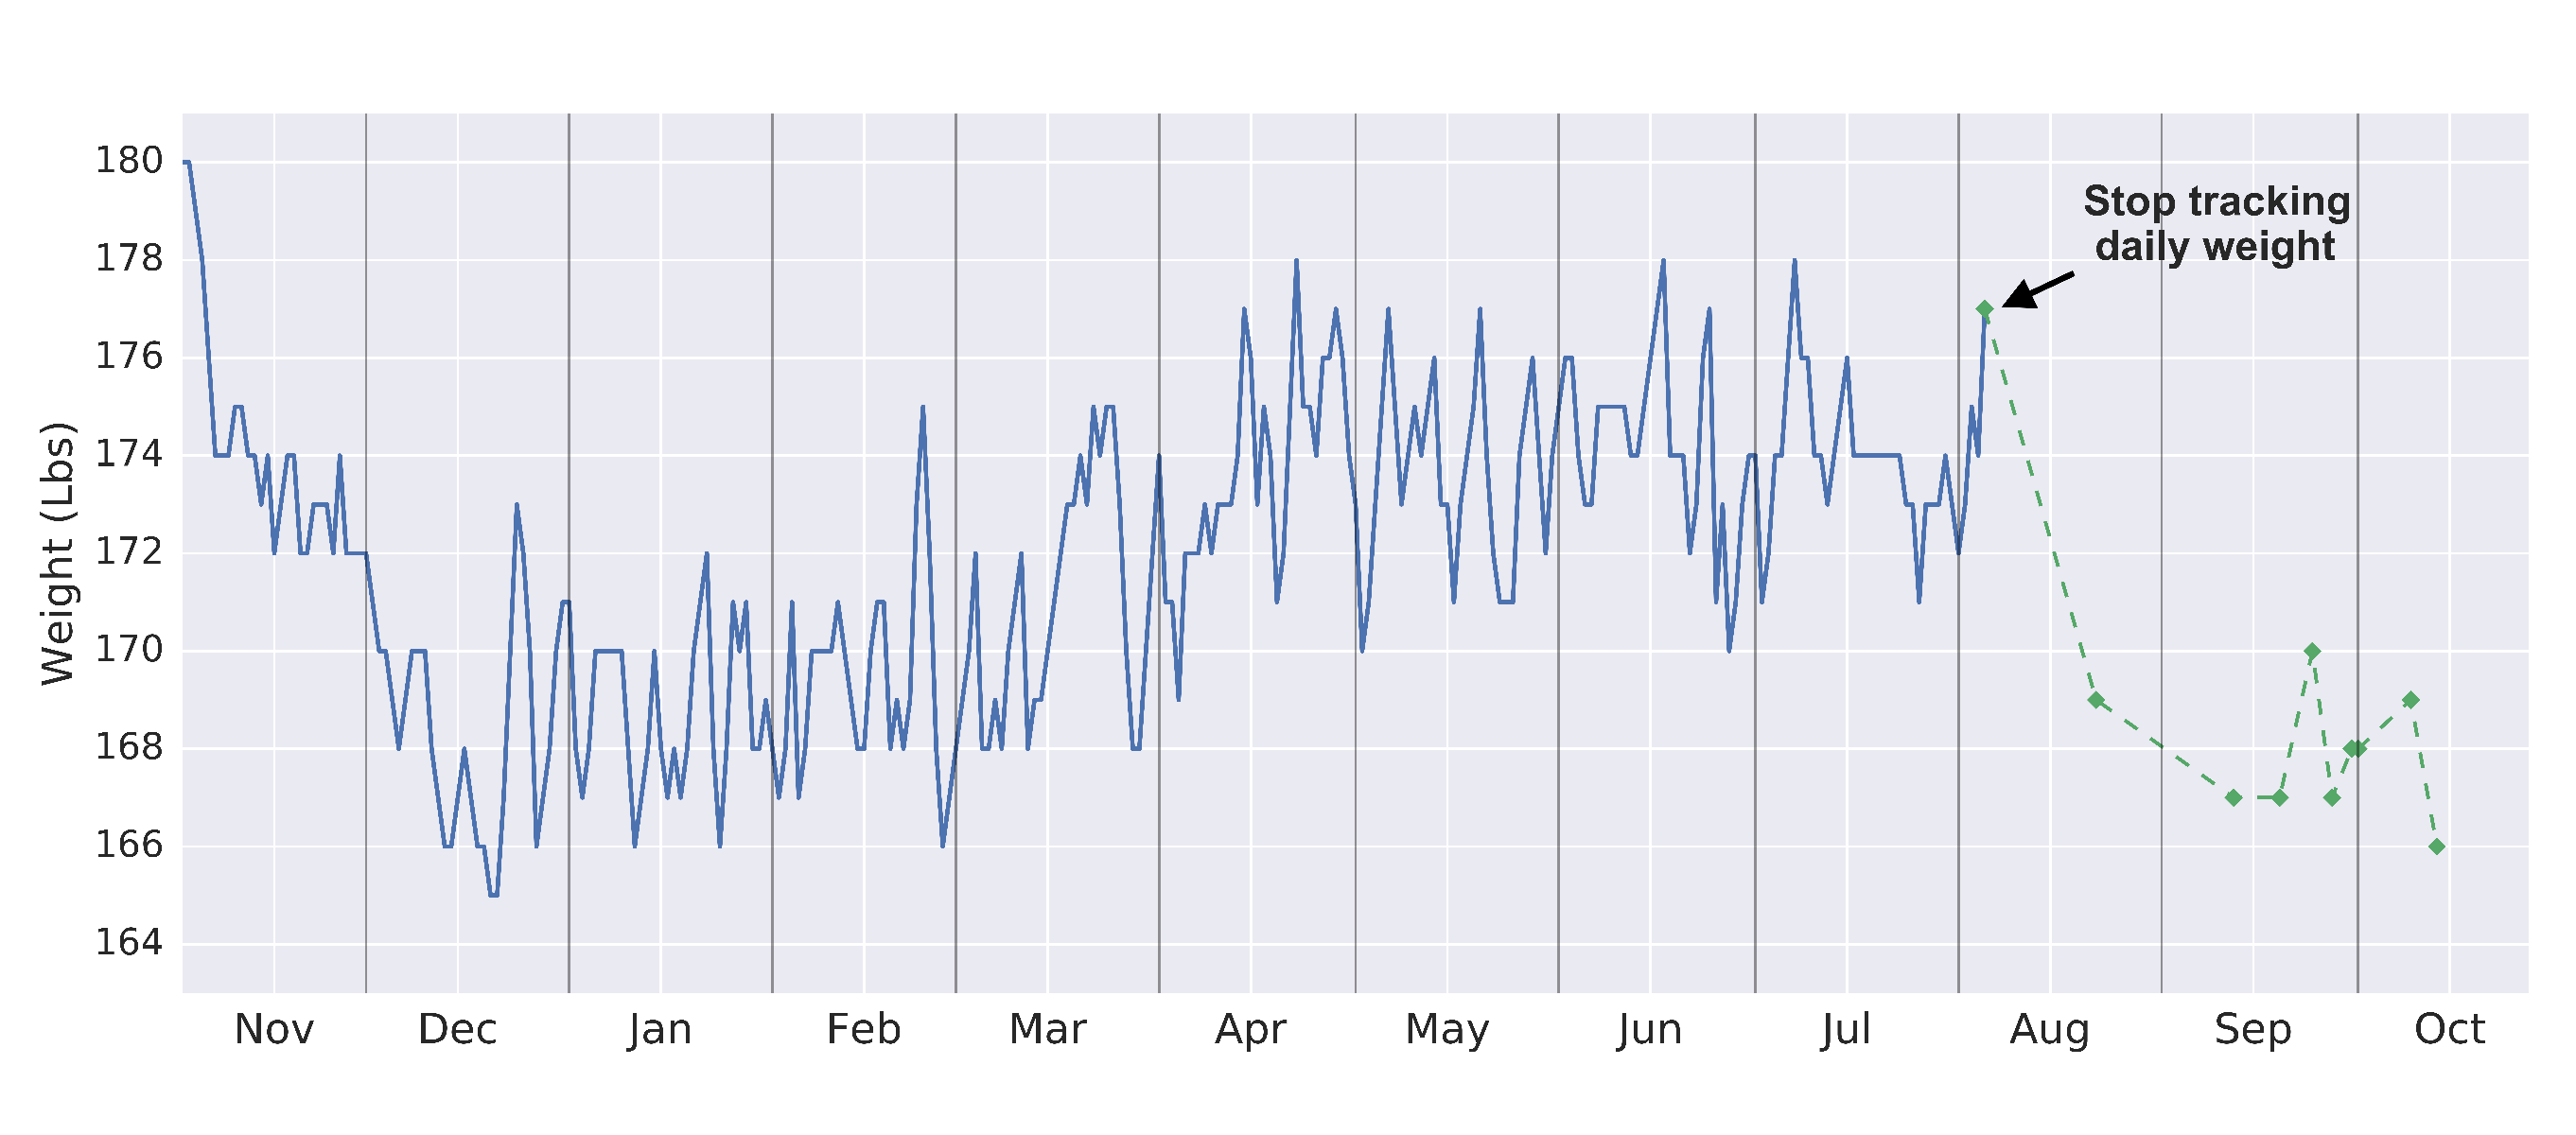
Weight Over Time
-
I was really excited for that initial dip from 180 to 165 which ended in mid-December. I thought that I would continue to lose weight at the same rate forever, but I was definitely wrong
-
After my initial weight loss sprint, I found my mentality relax and let myself eat more (as evidenced by the net calories graph above), which eventually cost me. By mid April, I was pretty much right back where I started at the beginning of all this
-
Even when I got my act together a little bit and started controlling my eating, my weight didn’t really change and instead hovered around 175 for several months.
-
Only in the last two months (September and October) have I seen weights as low as those from last December. I think part of that is because I stopped tracking weight daily but more on that later!
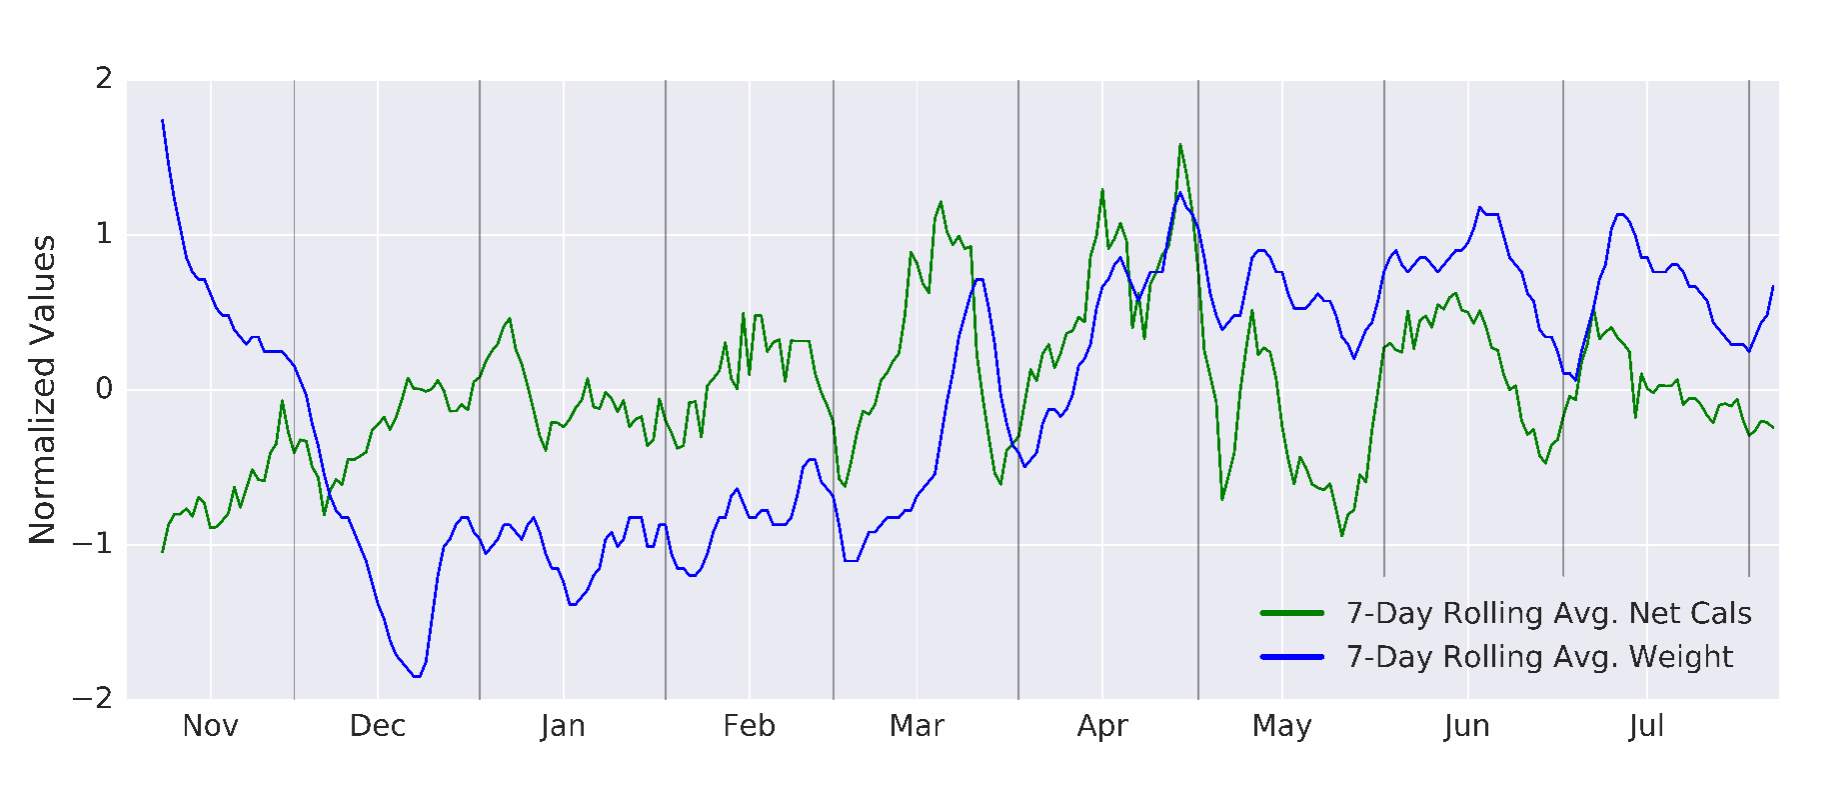
Of course, we haven’t seen net calories and weight on the same graph yet so let’s see how they compare. Since they are on different scales, I have normalized both of them (essentially get them on the same scale without changing the shape of the data).
How do Net Calories Correlate with Weight?
-
The first month seems odd since my net calories are increasing while my weight is rapidly dropping, but I attribute this more to the fact that last November is when I first started seriously working out after several college years of relative inactivity. My body seemed to appreciate that
-
The really cool thing is that after the first month, these two lines seem to follow each other rather closely, especially since this March! If you’re wondering why there is no data past July, that’s because I stopped tracking my daily weight in early August, but as promised, more on that soon
Key Negative (-) : Health Became a Game
Whenever you start intentionally and frequently keeping score of something, whether its your finances, your work performance or, in this case, your health, that thing can start to feel like a game. This seems like a potential positive since you want to score the most points and therefore stay motivated but it can also take a serious mental toll.
That’s what happened to me in early April.
Up until April, the sole statistic I was judging myself by was net calories. Additionally, I had set my goal to always keep my net calories under 2000. While this worked for a while, I soon started to find myself trying to “hack” my own system.
That is, if my net calories at the end of dinner happened to be something like 1500, I would find myself eating something I didn’t need just because I hadn’t yet hit that 2000. In my mind, I was being clever. Meanwhile, my body paid the price since I was usually eating garbage foods like ice cream, chocolate, etc. Also, I was much less inclined to work out on days like these because my net calories were already under 2000, so why work to reduce them further?
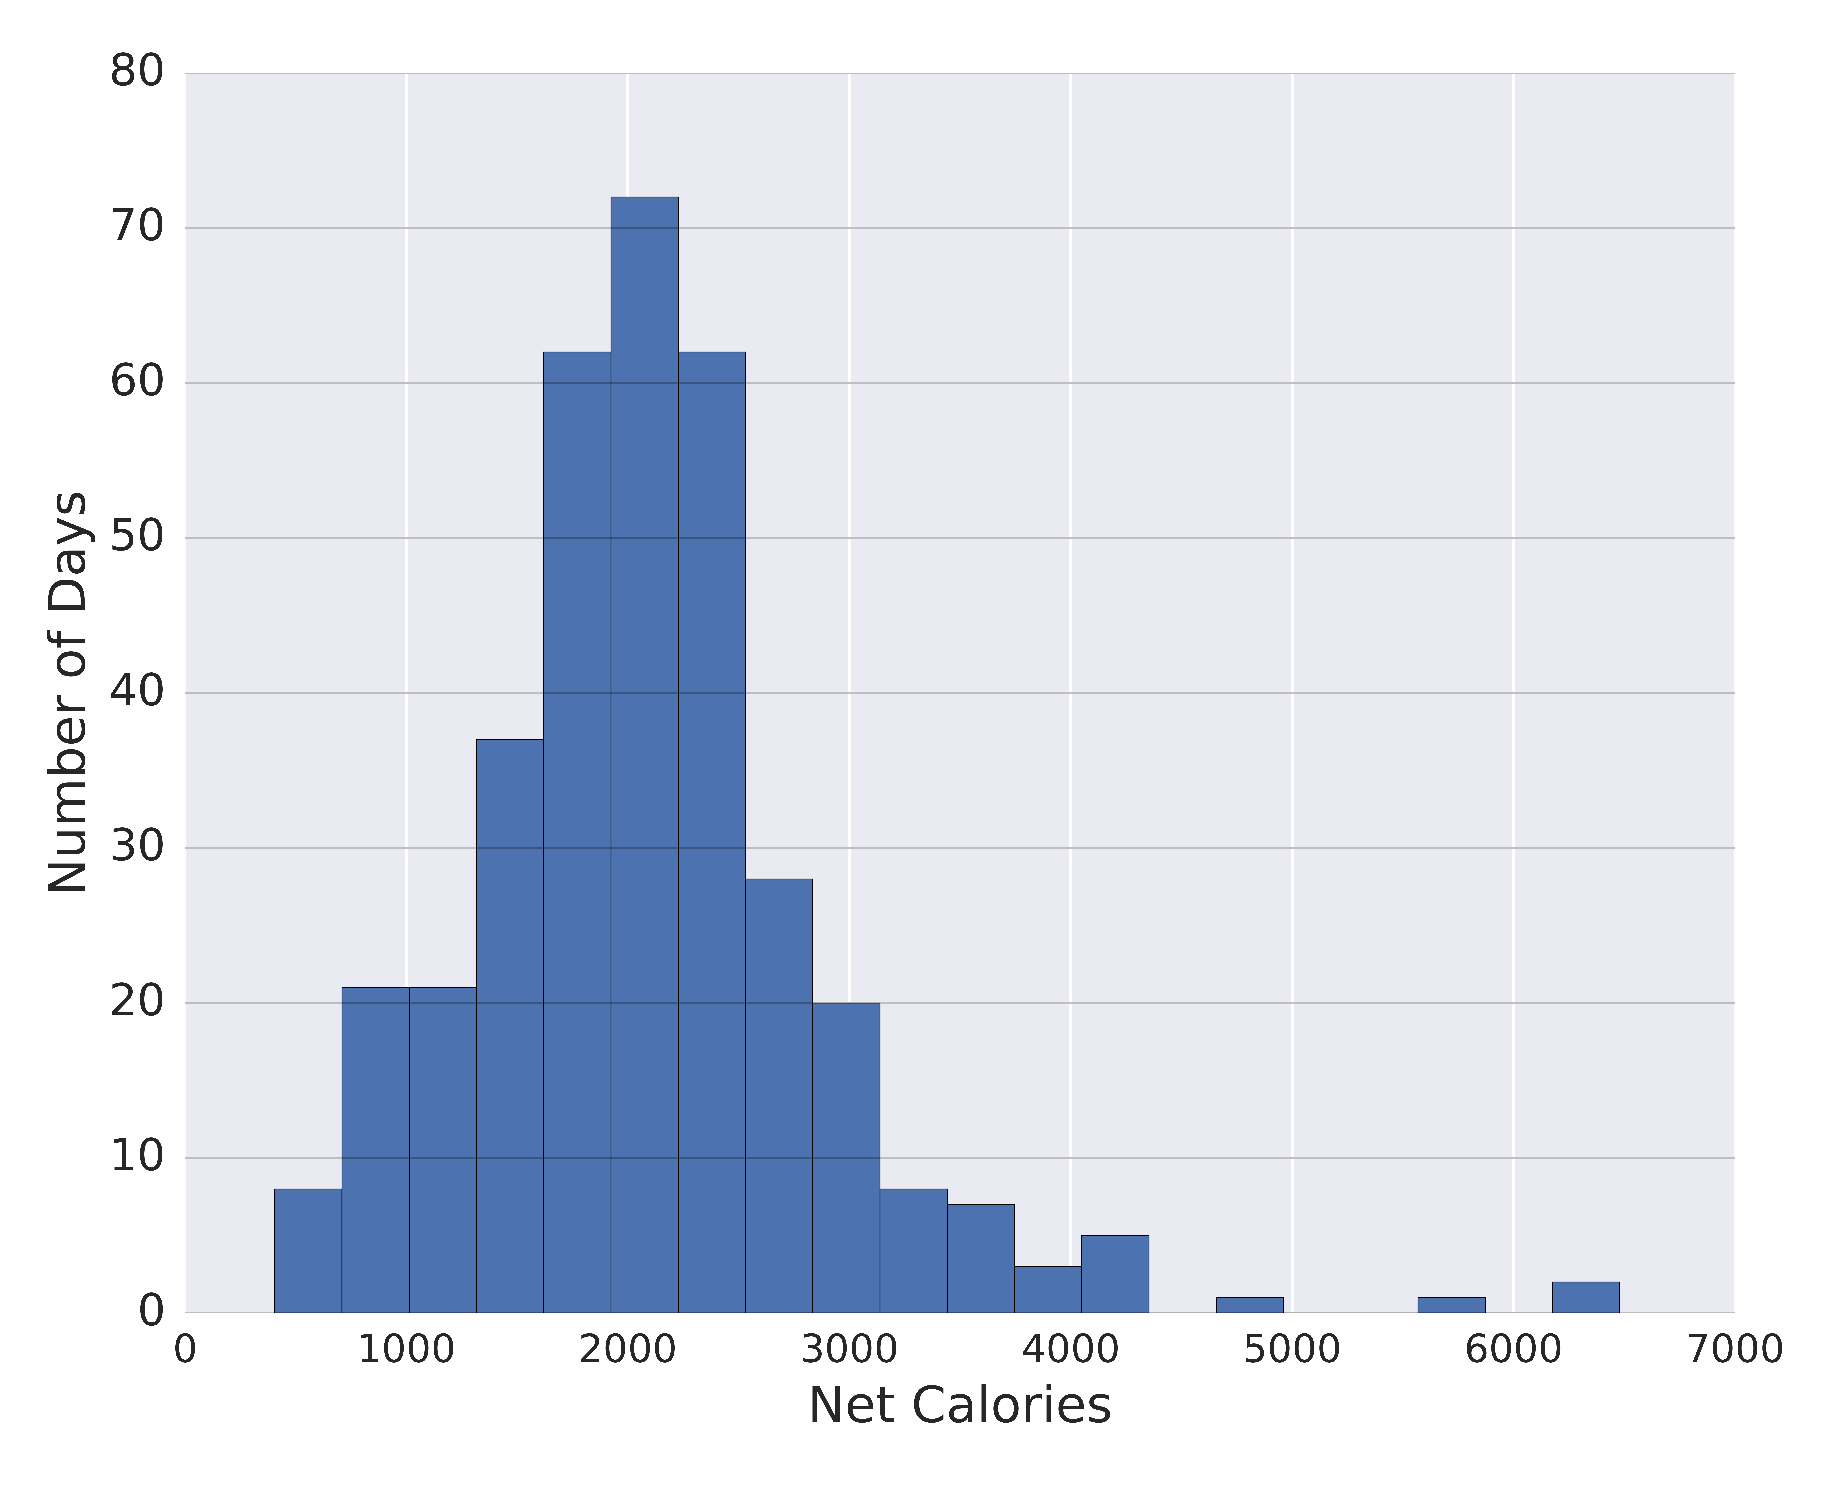
Indeed, when I made a histogram of net calories, most of my days cluster tightly around 2000:
Distribution of Net Calories
This is around the time I came up with a second metric which would dethrone net calories as the sole dictator of whether I was healthy or not. This metric was called the Calorie Out-In Ratio and is defined simply as Calories Out divided by Calories In.
To see the power of this metric, compare these two potential days. In day 1, you consume 2000 calories and burn 0 calories, resulting in 2000 net calories. In day 2, you consume 2500 calories and burn 500 calories, also resulting in 2000 net calories. But, I would much rather be in day 2 since I have the same net calories but also the added benefits of a good workout. The out-in ratio captures this since the ratio is 0 for the first day but it is 0.2 (500 calories out divided by 2500 calories in) for the second day.
The nice thing was that I had all the information I needed to backfill the out-in ratio values for the five months before I even started using this metric. So, I was able to check my progress on this metric over time as well:
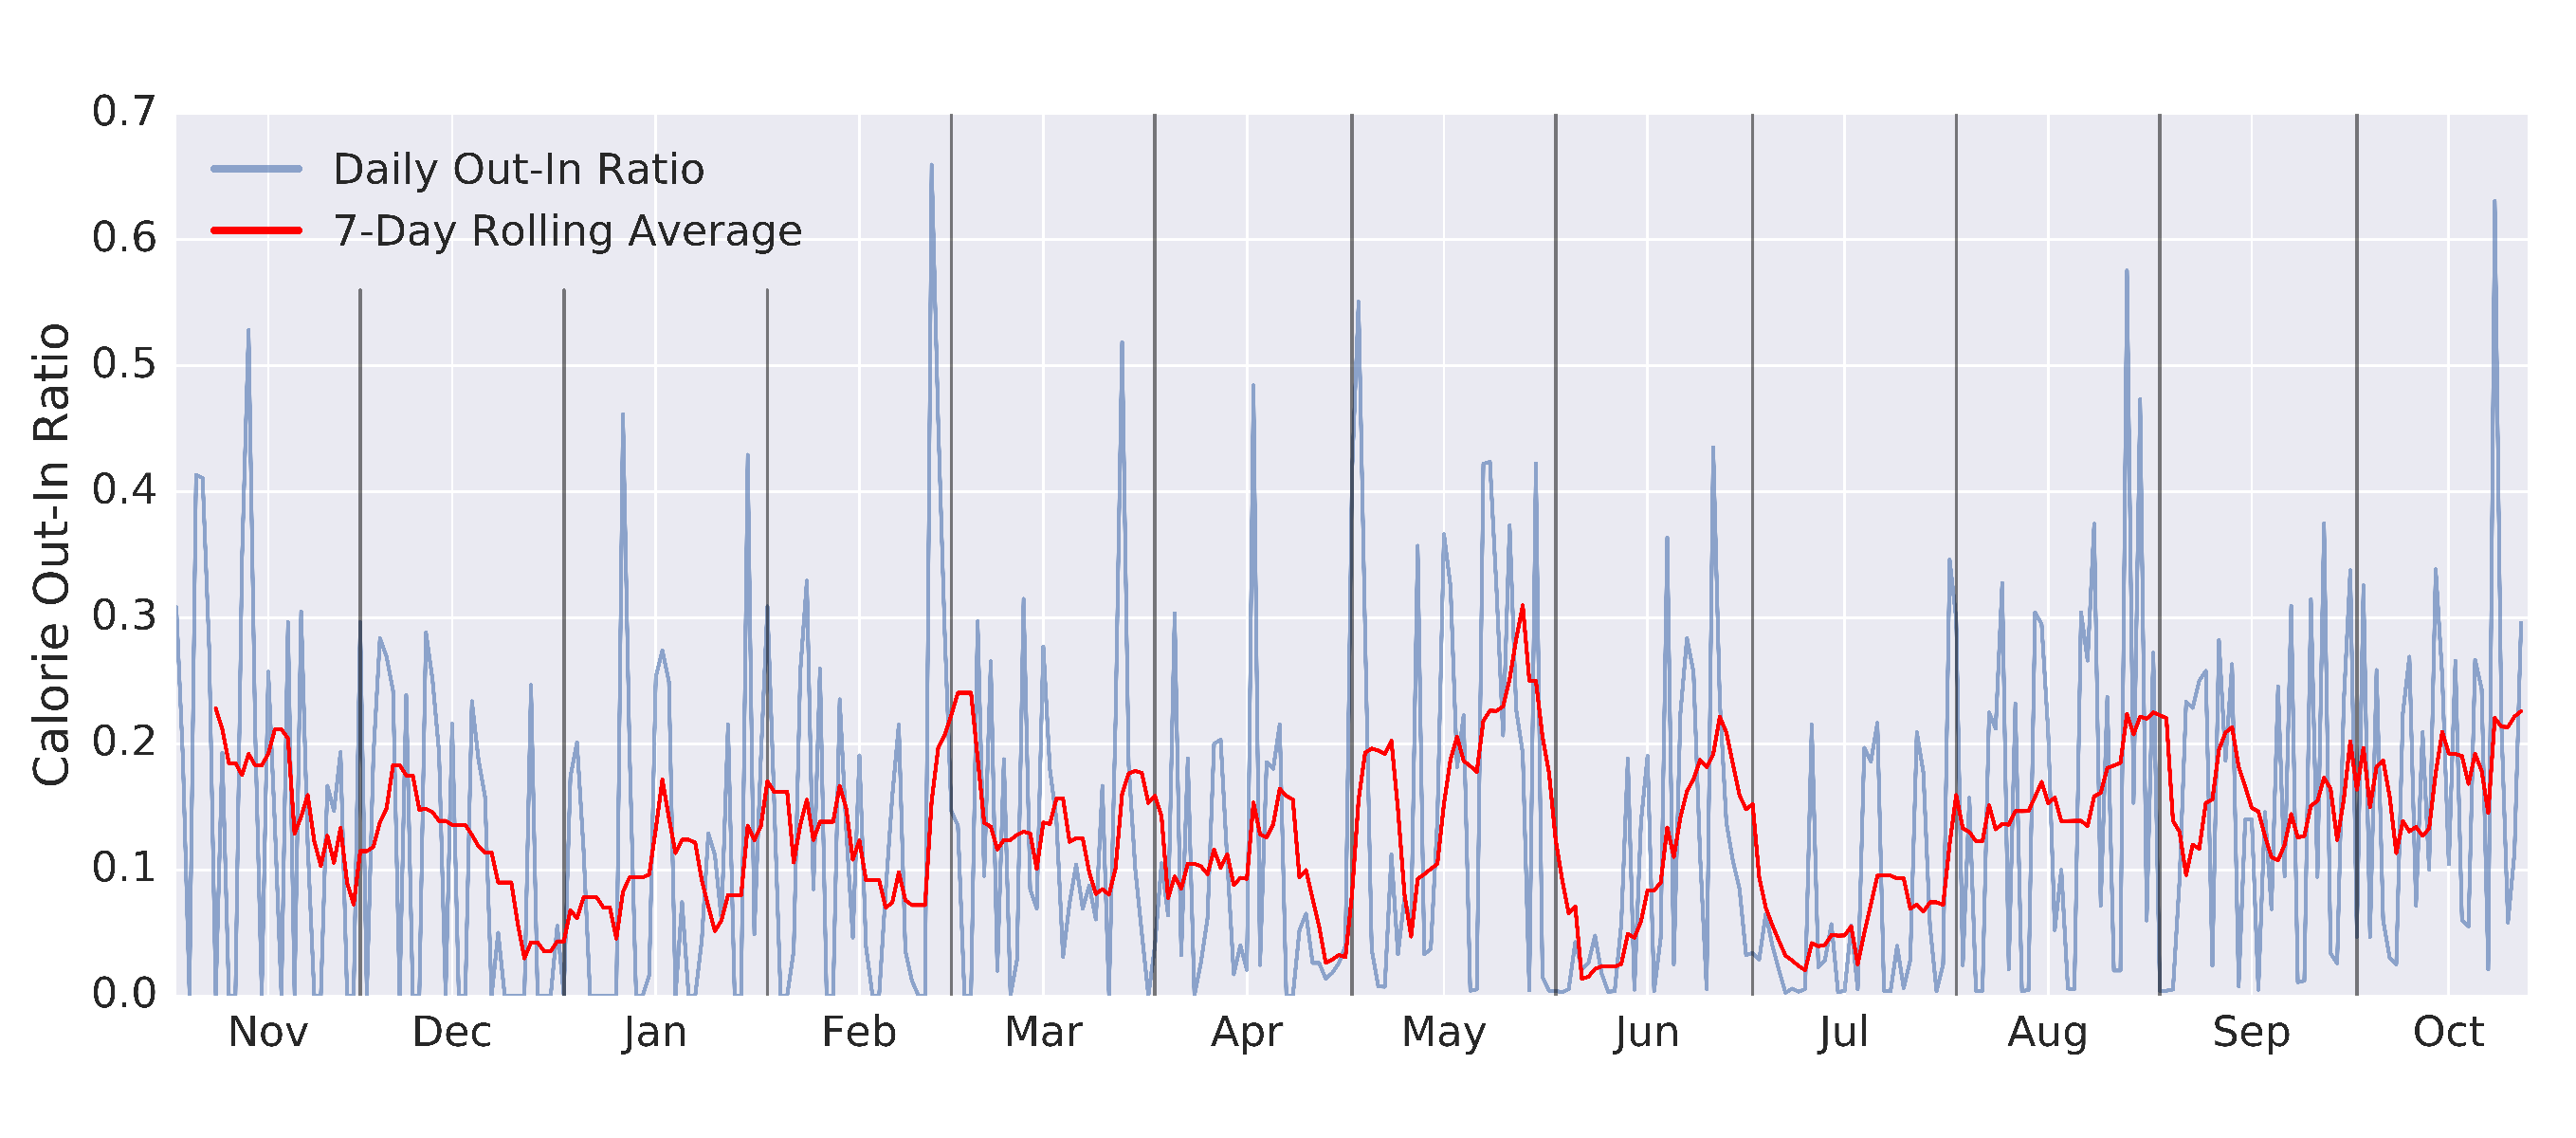
Caloric Out-In Ratio Over Time
-
This metric was stable around 0.1 for a long time until it spiked in late May, which is when I started working out more and eating less in response to the health flashpoint in late April
-
After a sharp dip in June and then again in July, the out-in ratio has been steadily rising for the past three months, approaching 0.2
Since April, I have found myself much less inclined to “hack” my own system and have felt more stable using both net calories and the out-in ratio to determine my healthiness for any given day.
Key Positive (+) : Calories Become Currency
One consistent positive through this past year has been that I have started to view calories as a form of currency. Before tracking my health, I would just eat what I wanted and periodically regret my decisions. Through the past year however, I have found myself thinking through my day ahead of time. Around lunchtime, I will start thinking about how much I want to eat based on whether I have plans for a big dinner, want to treat myself with a nice dessert, or whether I made it to my morning workout.
There are definitely moments where I have considered eating some birthday cake at work but have stopped myself because I don’t have “enough calories to spend”. Indeed, this shift in mentality, which took me several months to really solidify, helps me treat calories as the resource they are and helps me impose limits on my consumption.
Key Negative (-) : Overaccountability
One big goal at the beginning of my health tracking was to keep myself accountable if I ever failed to meet my goals. When net calories was still my primary performance metric, I had included a column in my data named “Reason”. Any day where I went over 2000 net calories, I made myself write down the reason why I had failed.
This worked for a while and helped me understand what might cause me to fail, but it soon became really oppressive. There were weeks where I had several social outings or had less time to go to the gym and I would consistently find myself explaining my failures to myself in writing. It went from informational to downright demoralizing.
So, along with the adoption of the out-in ratio I mentioned earlier, I removed this column from my data. I opted to instead just mentally note if I ever failed to meet my goals and think about the day ahead rather than keep a running tally of how many times I had failed.
As my goals shifted a bit in early March to focus more on getting physical activity, I opted to trade the above mentioned “Reason” column for two new columns in my data called “Cardio?” and “Weights?” each of which were just a yes/no for whether I had completed a cardiovascular or weight training workout that day. These simple two metrics personally work really well for me, making sure I get myself to work out often without being too overbearing. They allow me to track how my workout frequency as changed through the year:
Cardio and Weights Workouts Over Time (each black bar represents a day of working out)
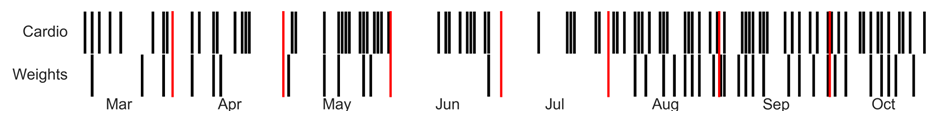
- The biggest takeaway from this graph are that my workout frequency has stabilized in the last few months but is much better than the low periods in June and July
Also in early March, I started tracking my general mood at the end of each day, which I simply picked as either being :), :|, or :(. It was definitely my least “scientific” metric but nevertheless one which helped me think about why my day went the way that it did. Mood was definitely a function of so much more than my measured health statistics, but there was still a strong relationship between mood and calories as shown below:
Relationship Between Calories and Mood
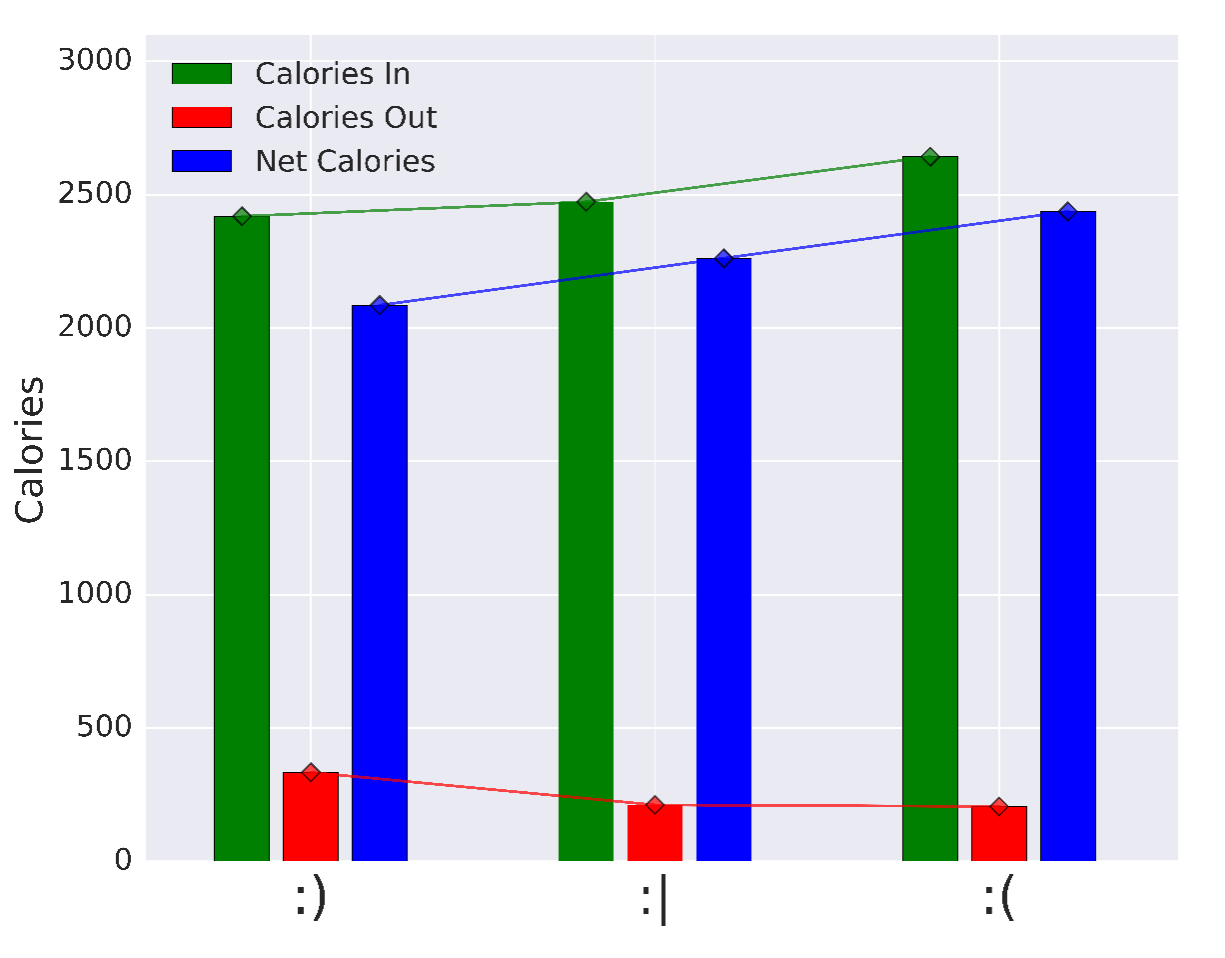
- It is pretty clear to see that the average calories-in increases with decreasing mood, and the average calories-out increases with increasing mood. While there is really no real science I can give here, I can say that I felt much better on days where I got a workout in and when I didn’t eat so much that I felt like crap at the end of the day.
More recently, in early August I became so fixated on losing weight that I found myself visiting the scale three or four times in a single day, often surprised when nothing had changed in two hours. I knew that weight was one of the biggest metrics that I wanted to track, but also that this daily tracking was morally killing me. I opted to forego the potentially useful data in favor of my sanity. I’m currently at a system where I just check my weight a few times a month and note it down rather than checking it every day.
Conclusions
I think health tracking has been an overall positive for me in the last year, and something which does not take a lot of effort, especially with advanced health monitoring apps these days. Still, it is important to note the negative toll that constantly monitoring your health can have on your … well, health. As always, a good balance along with trial and error are the best tools at your disposal.
I hope that some of the thoughts and data above help you decide whether or not you want to start tracking your own health!
Thanks for reading and please leave comments below!
Data Collection Notes
As noted above, this project initially started by just measuring three metrics each day: calories in, calories out, and weight.
I measured calories in as accurately as possible, researching nutrition facts when they were available, and making my best estimate when nutrition facts were not readily available.
Similarly, I calculated calories out by consulting caloric burn rates for various exercises based on my weight at the time. It is also important to note that this does not include calories burned at rest. That is, I recorded calories burned from intentional physical activities only.
I calculated weight using an electronic weighing scale I have at home and tried to make the measurement around the same time each day.