Detecting Cheating in Lecture Halls
I recently got to thinking about how a college professor could detect whether or not students were cheating on a class exam. Of course, the only way to definitively accuse a student of cheating is to observe them cheating in the moment. That is, observe them looking at another student’s exam, for example. Still, there had to be some statistical ways to determine whether cheating had occurred during the exam even if you can’t prove which students were responsible.
The idea would be fairly simple. From here on out, pretend you’re the professor of your favorite course (and comment that course below!).
-
First, you would randomize students to seats on exam day, perhaps alphabetically or display a randomized seating chart for students to follow.
-
Second, after the exam, you would count how many pairs of students (students sitting right next to each other) had the exact same score on their exams.
-
Third, you would ask yourself if that many pairs with identical scores was “normal” or if it was too high to be a coincidence.
Seems simple enough? Cool! Let’s talk about some of the details and run through an example.
For this to work, you’ll need three assumptions to hold. Good news is that these assumptions aren’t far-fetched.
-
First off, you (the professor), need an adequate number of students in the course so that you don’t run into issues with too small of a sample size. In reality, most lower division and some upper division courses at many colleges can get quite large. For our example we will assume a lecture hall which is 15 seats by 20 seats so that it accommodates 300 students on exam day.
-
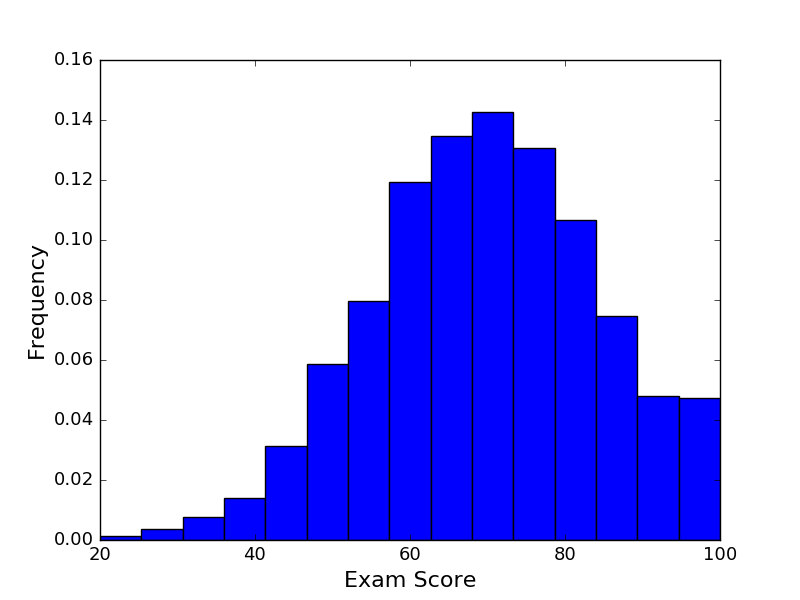
Second, we will assume that you have taught this course multiple times in the past and understand well what the grade distribution should look like. This, again, is realistic for a professor who has been teaching a course for multiple terms. For our example exam, we will assume that the grades are usually distributed normally (as in a bell-curve) with mean 70% and standard deviation 15% with a maximum possible score of 100%. This distribution is shown below.
Expectation of Exam Distribution
- Third, we assume that cheating can only happen between students sitting right next to each other. Although it is possible that students can cheat off of the person sitting ahead of them, the fact that there is a body in the way makes it much harder.
Before the Exam
Before the exam, you’ll want to understand how many pairs of students (sitting right next to each other) you should expect to have the same score on their exams. Indeed, just because two students sitting right next to each other got the same score doesn’t at all mean either one cheated. This can and will happen by chance even with randomized seating.
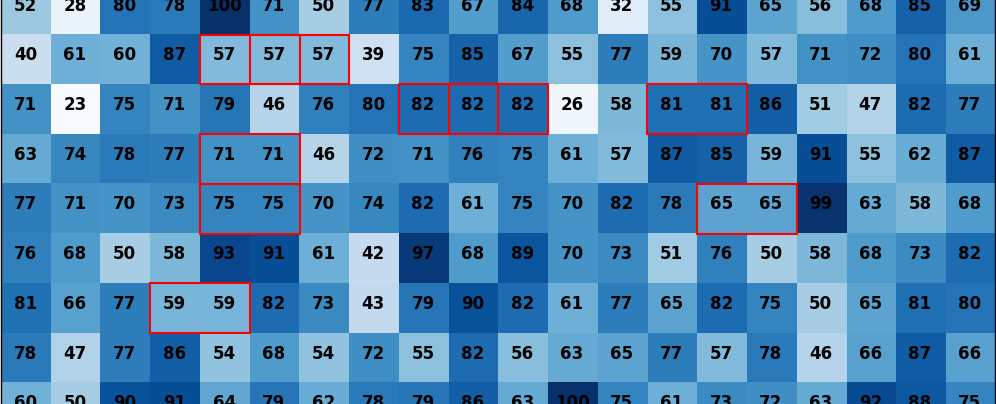
To understand this, we can run a simulated exam. Assign each of the 300 students in the lecture hall a random grade from our well-understood grade distribution above. We will end up with a lecture hall score heatmap like this one.
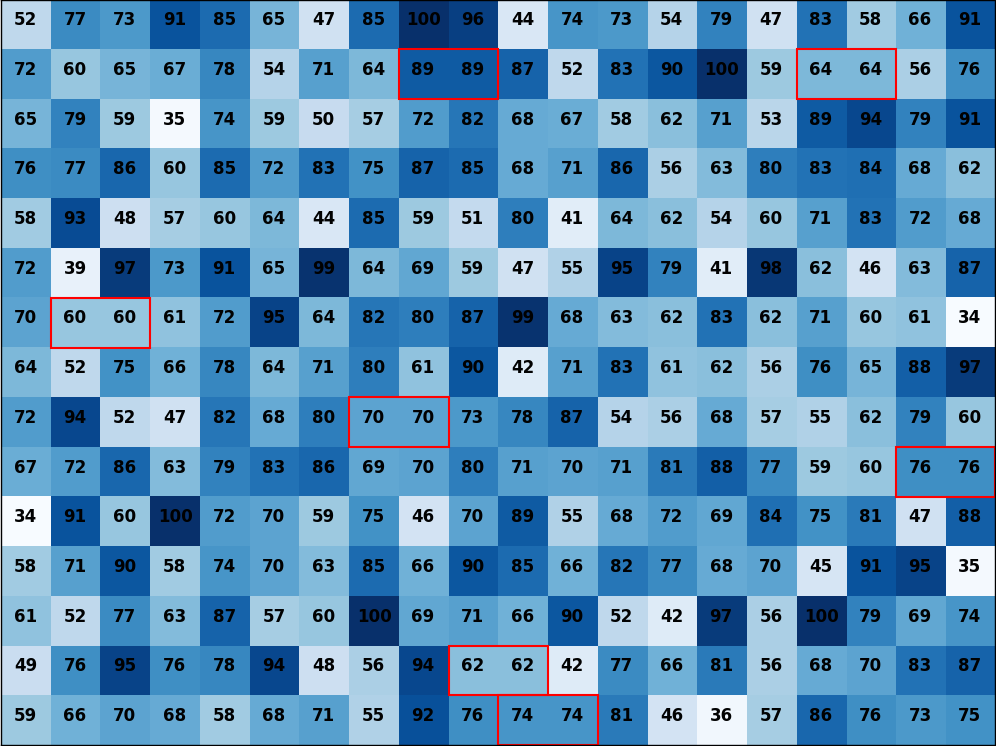
In the red boxes, we have identified which seating pairs got the same exam score.
Now we count how many pairs of students get the same score (7 in the picture above). Divide this count by the total number of possible adjacent seating pairs of students (285 in the picture above). We then get a percentage of how many pairs got the same score (7/285 = 2.5%).
Record this percentage in a list and then run another fresh simulation. Repeat this over and over again (we do 10000 such simulations). In the end, we get a new distribution, this time telling us how likely it is for a pair of students to get the same exam score. We show this distribution below.
Percentage of all Student Seating Pairs Receiving Same Score
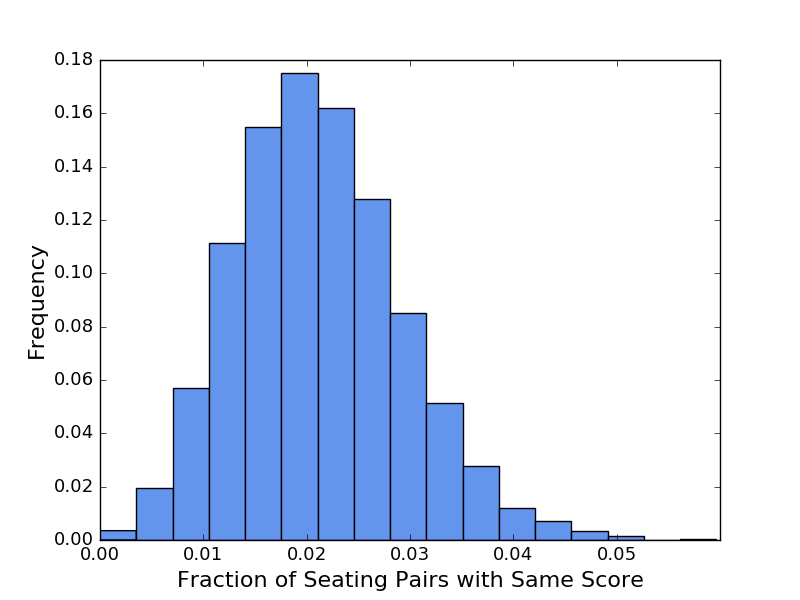
We see that this seems to be distributed in something like a bell-curve but with a long right tail. We see that on average, around 2% of all student seating pairs receive the same exam score when there is no cheating going on.
During the Exam
During the exam, as we mentioned earlier, we will randomly assign students to seats, allow the exam to progress, look out for any clear signs of cheating and then record all student exam scores along with their assigned seat.
It is worth noting that we randomly assign students to seats to control for other reasons for adjacent seated students to have similar scores, such as the possibility that they are friends who studied together in a very similar way.
After the Exam
After the exam, we will create a heatmap of the student scores and identify which seating pairs of students received the same score. Such a map is shown below.
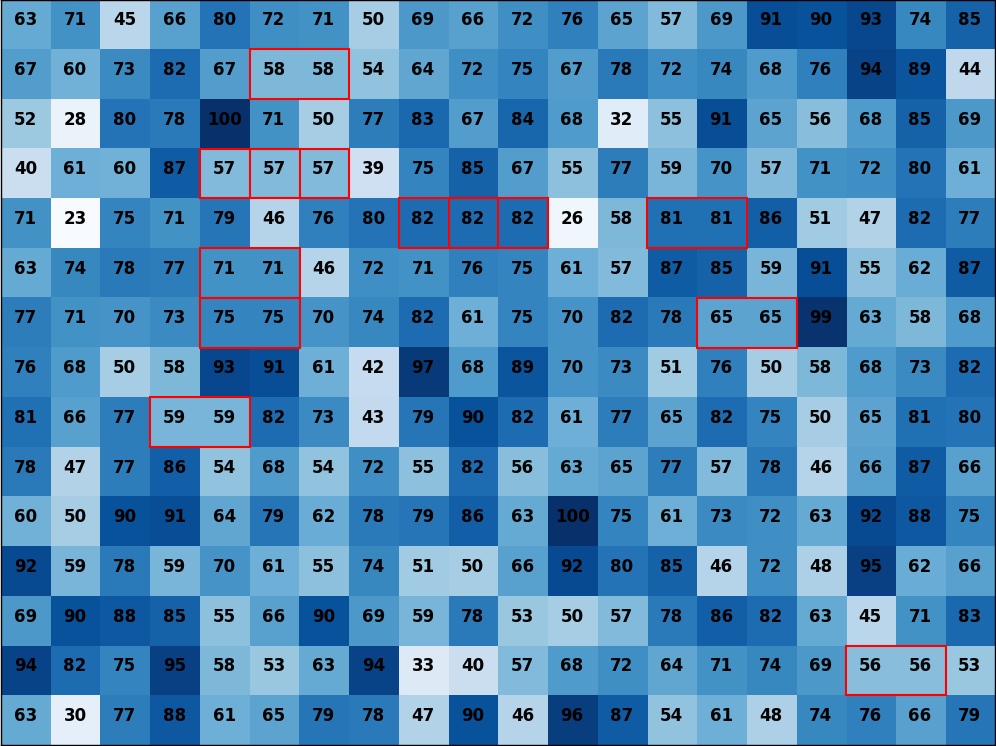
We count 11 seating pairs with the same score in the map above. As a percentage, this means that 11/285 = 3.86% of seating pairs got the same score. Given that the average was more like 2%, this seems suspicious but how do we tell for sure?
We just need to ask ourselves one question: if there were no cheating during the exam, how likely would it be to see a same score seating percentage of 3.86% or more?.
If the answer to this question is fairly likely, then we should not have any suspicion of cheating. However if the answer is extremely unlikely, we should be fairly confident that there was some cheating going on.
To visually answer this question, let’s see what part of the student seating pair same score distribution lies past 3.86%.
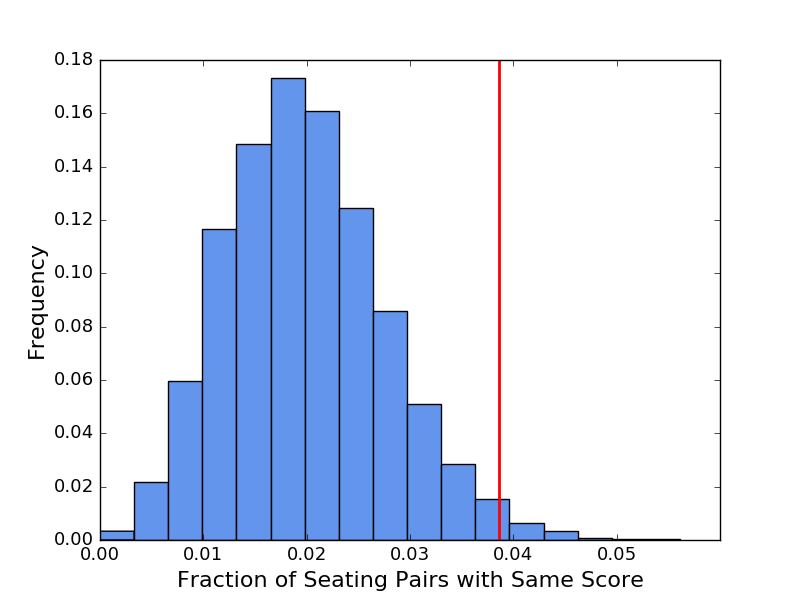
Adding up the height of the bars past the 3.86% vertical red line, we get 2.2%. To put that in words, if there was indeed no cheating during our exam, there is a 2.2% chance of seeing the 3.86% same score rate or an even higher rate. Put more fundamentally, it is very unlikely that we got the scores we did without cheating having occurred.
Note that this still doesn’t give us a clue which of these student pairs actually cheated, so we cannot use this insight to start accusing students. But, we can use this insight to better prepare for the next exam by printing different test versions, having more proctors to watch out for cheating, or including a required signature on an academic honesty agreement on the exam’s first page.
Limitations
This technique can help determine when some forms of cheating have occurred but it still has its limitations, namely the following three.
-
First off, it only factors in students with the same score sitting next to each other. We can imagine a slightly modified version of this technique where we count a student seating pair if their grades are within plus or minus 2% for example.
-
Second, this technique will not detect global cheating such as if half the class got access to the answer key before the exam. For that we need to analyze more the grade distribution.
-
Third, this technique will not detect single-student cheating such as the classic case where a student brings in an illegal note sheet. In this case, an analysis of this student’s past performance in the class versus his/her current exam grade may be in order.
Thanks for reading and please leave comments below!