
Where Can You Afford Avocado Toast AND a House?

We all know that millennials love avocado toast. We all also know that millennials can’t afford a house. Well worry not! This post will answer the question of where you should move for the best chances of buying both a house AND your precious avocado toast.
The Data
The dataset used in this post is a combination of data from three sources.
The first dataset is from the Hass avocado board and contains information about avocado prices and quantities sold over time and in each U.S. region.
The second two datasets come from the U.S. Census Bureau and contain information on average income by U.S. county and average house price by U.S. county.
Note that we will be considering Large Hass Avocados here, as they are the most popular and we don’t want interference in our data from different types of avocados.
Methodology
Let’s start by recognizing that getting our answers isn’t as simple as ranking each U.S. region by avocado price or house price. It really depends on your income too. For example, if avocados are twice as expensive in City B as in City A, but your income in City B would be four times as much, you’d be better off living in City B since you can afford twice as many avocados, all else held constant.
So let’s define two sensible scores for each U.S. region:
\[\text{Housing Score} = \frac{\text{Average Income}}{\text{Average House Price}}\] \[\text{Avocado Score} = \frac{\text{Average Income}}{\text{Average Avocado Price}}\]So we really want to find the U.S. cities where both Housing Score and Avocado Score are maximized. But how do we maximize two metrics at once? Well suppose we are comparing two cities, City A and City B, and we plot their Housing Score and Avocado Score on a grid.
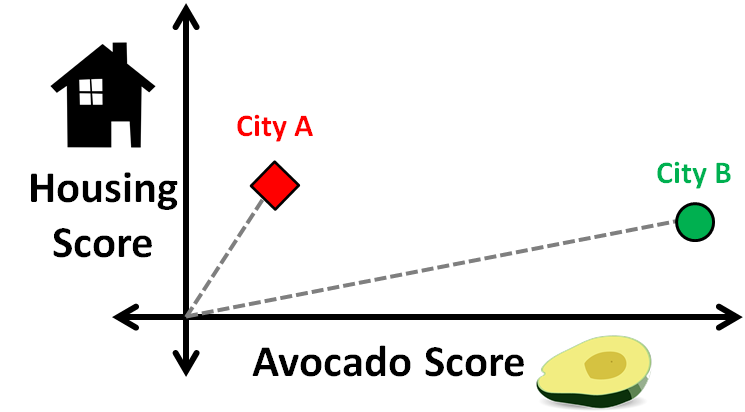
We see that City A has a slightly higher Housing Score than City B but City B has a much higher Avocado Score than City A. So, we go with City B here. Another, more graphical way, to describe our decision is that we went with the city which was furthest from the origin, (0,0).
This is a good place to note that we will be normalizing the Housing Score and Avocado Score for this analysis. That is, for a fair comparison we will be bringing those two scores into the same ballpark since houses tend to be more expensive than avocados.
Let’s see the results using our real data!
Results
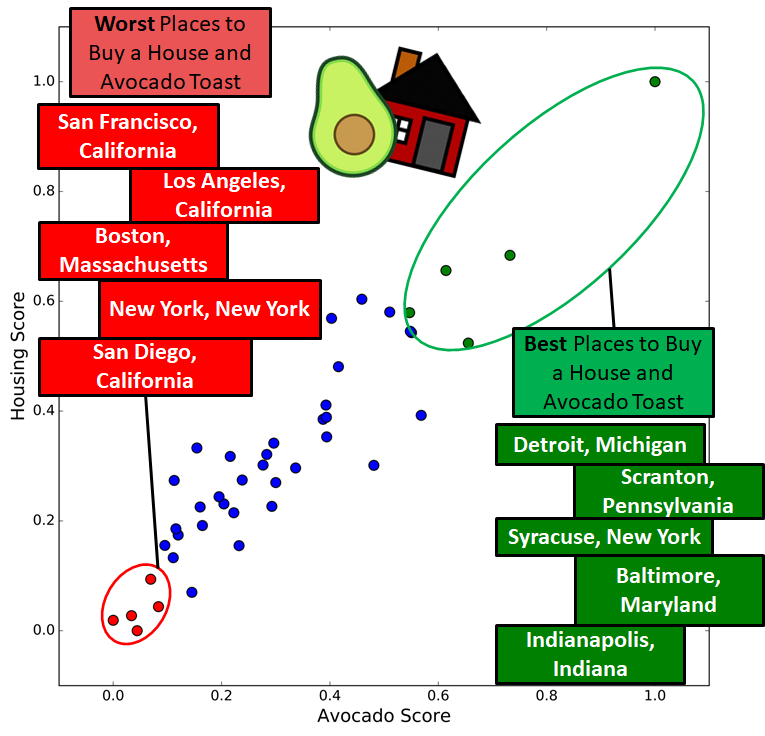
We see here the five worst cities to live in when it comes to buying a house and avocado toast are closest to the origin and the five best cities are furthest from the origin.
A lot of this just confirms what y’all probably presumed already. I mean did you really expect to be able to buy a house AND avocado toast in SF? HA!
So you should just move to Detroit then right?
Not so fast! There’s more to the story. We haven’t even explored the time component yet. Let’s ask one more question before we close: Where are avocado prices rising the fastest?
We will look at data since the beginning of 2015 and calculate the average rate of increase in avocado price over time. Below we show the city with the slowest increase in price, the one with the fastest increase, and one in the middle.
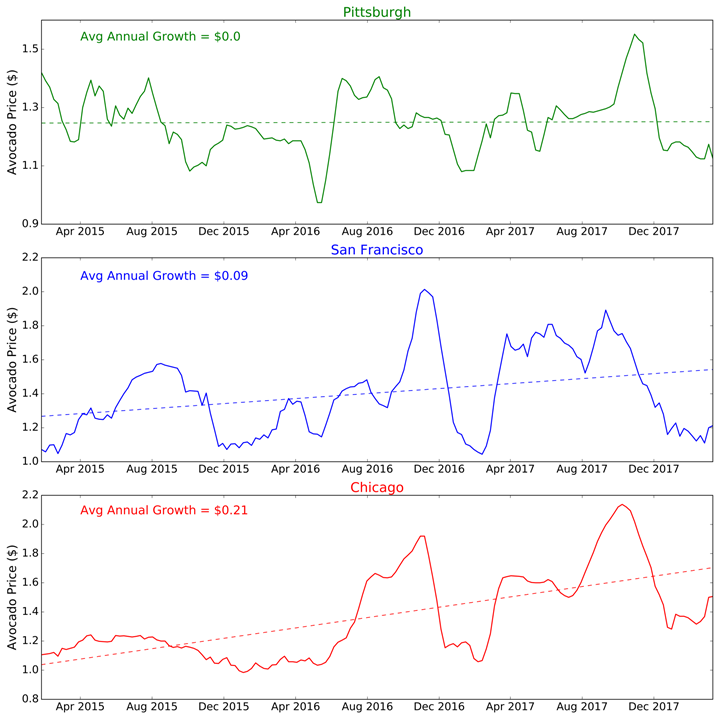
Definitely go live in Pittsburgh if you value stable avocado prices over time. And if you are scared of your avocado toast getting increasingly more expensive, you’re definitely gonna want to avoid Chicago with an average 21 cent increase per year!
What about for other major U.S. cities? Let’s look at the average annual price growth in avocados for the most populous U.S. cities.
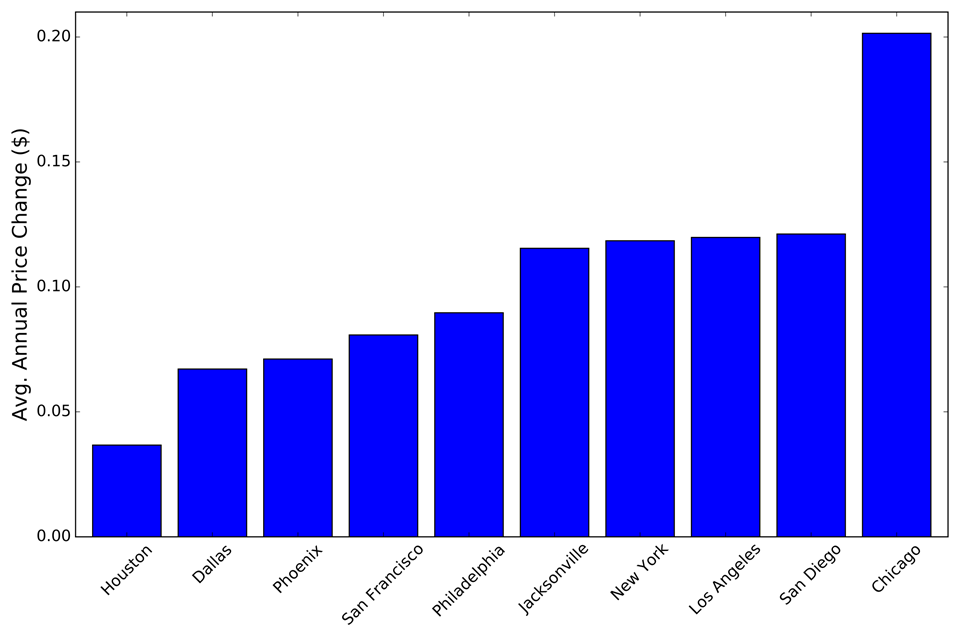
This makes it clear that Chicago is definitely an outlier in terms of avocado price growth with most cities under about 13 cents per year. With Houston and Dallas boasting some slow price growth, maybe Texas is your new home.
Note that some populous U.S. cities were omitted because Hass did not specifically have avocado price information for these cities.
Conclusion
Ok, honestly this isn’t a scientific report. It’s obviously more just for fun. We didn’t take into account neighborhood within cities, the price of the toast part of avocado toast, salaries by different professions, and a hundred other things. Still, it’s pretty cool to take a look at the housing-avocado situation, on average, across the nation.
Thanks for reading and please leave comments below!