
Optimizing Your Chances of Medical School Admission
In 2016 there were 27,772 students who applied to Medical Schools across the United States. Of these students, 8,883 were granted admission, an admit rate of 32%. But of course, the overall admit rate is not very enlightening. The data we are really interested in for this post is about how that admit rate changes based on GPA and MCAT (Medical College Admission Test) score.
We of course know roughly that a higher GPA and/or a higher MCAT score will lead to a higher chance of admission, all else held constant, but we want to really get down into the details here. Our analysis will progress by asking a series of questions:
What are the patterns in Admit Rate vs. MCAT and Admit Rate vs. GPA?
Given these patterns, can we build an all-encompassing model to predict admit rate given MCAT and GPA?
Given this model, can we recommend a path for prospective medical school students to optimize their chance of admission?
To answer these questions, we will be using data from the Association of American Medical Colleges which gives the admit rates for select ranges of GPA and MCAT score.
Let’s Start Simple. How Does Admit Rate Change Based on MCAT and GPA?
We all expect the chance of admission or admit rate to increase with increasing MCAT and GPA scores, but how? Linearly? Quadratically? Or something else altogether?
Let’s first look at the change in admit rate due to changes in GPA with MCAT held constant at various levels. Note that the MCAT is scored between 472 and 528 with a median score of 500. Below, we fix the MCAT to three ranges: 514-517 (High), 498-501 (Medium), 486-489 (Low). For each range, we plot the Admit Rate vs. GPA.
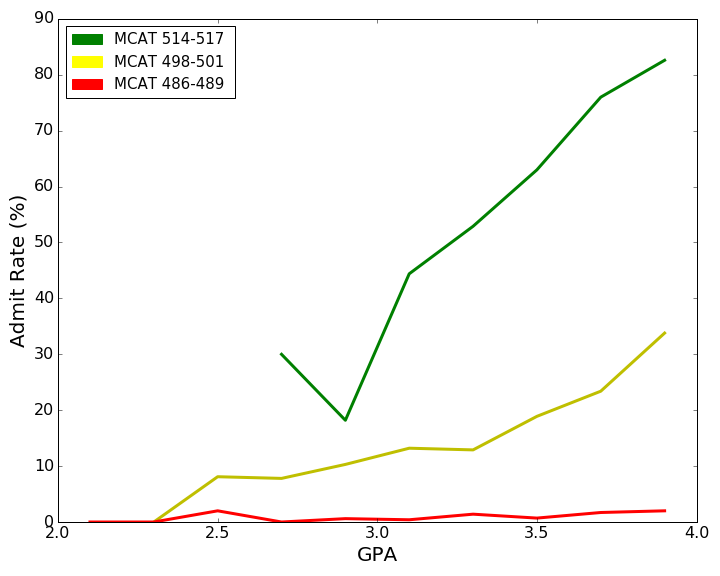
The key takeaways are:
- There seems to be a (roughly) linear trend in Admit Rate vs. GPA.
- The slope of this linear relationship increases with increasing MCAT scores. Put another way, the higher your MCAT score is, the more that each additional GPA point boosts your chance of admission. This is some preliminary evidence of a link between GPA and MCAT in determining admit rate.
- Given a low enough MCAT score, no GPA can make up for it in gaining admission to medical school. That is, looking at the bottom red line, where MCAT is between 486 and 489, a GPA of 2.5 vs 3.9 gives the same admit rate of around 3%.
Now let’s turn to a more interesting trend, that of Admit Rate vs. MCAT for some fixed values of GPA. Here we fix the GPA at three levels: 3.8-4.0 (High), 3.4-3.6 (Medium), 3.0-3.2 (Low). Note here that even though a GPA of 3.0 is labeled as low, you should take that to mean relatively low rather than absolutely low. Indeed, even those with a GPA in the low range can achieve a peak admit rate of 50% given a high enough MCAT score.
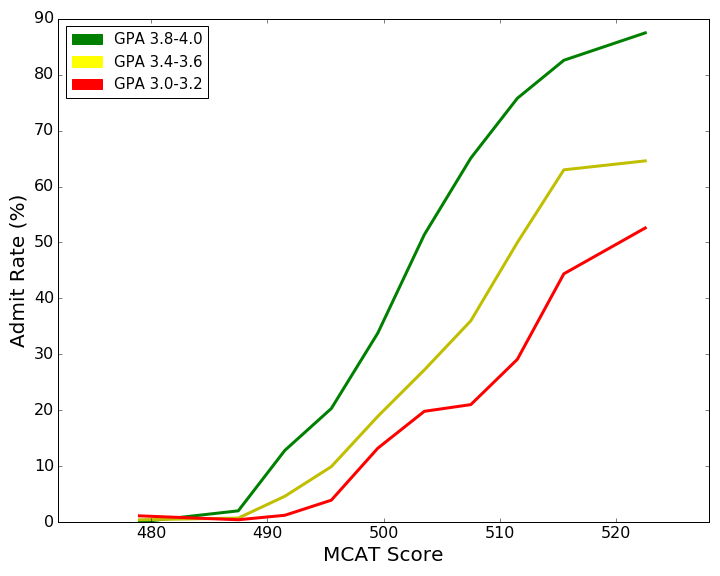
The most striking thing about this figure is that the curves do not follow a linear or quadratic trend but rather follow a mathematical shape called a sigmoid. Sigmoids, generally S-shaped curves, appear in many other contexts, perhaps most popularly in population models. They describe some process which is slow to pick up (a slow growth at the beginning), then gains momentum (fast growth in the middle), before finally capping off at some level (slow growth at the end).
Indeed they make perfect sense in our context too! Given a very low MCAT score, boosting that score by a little bit will help a bit in the beginning but not much. Once you keep boosting the MCAT score, you realize greater and greater gains, causing your admit rate to increase faster and faster. Finally, when your MCAT score is already fairly high, additional gains in your MCAT score do not help much.
Note also that the sigmoid shape is more defined for higher values of GPA. We also see the effect of different GPA levels on the sigmoid by, for example, looking at the admit rate for the highest value of MCAT among the three GPA bands. We see for the low GPA curve, the admit rate here is around 50%, for the middle GPA curve it is around 60%, and for the highest GPA curve it is around 85%.
For later usage, a common mathematical description of a sigmoid is given by:
\[f(x) = \frac{1}{1+e^{-x}}\]Cool Trends! But Can we Fit Models to Them?
Now that we some idea of the trends in admit rate based on GPA and MCAT, we would like to know if we can fit a (not too complex) mathematical model to these trends to predict admit rate for any combination of GPA and MCAT score with a decent degree of accuracy. Before tackling the whole problem, let’s just see how good we can do at predicting those sigmoids from the last figure.
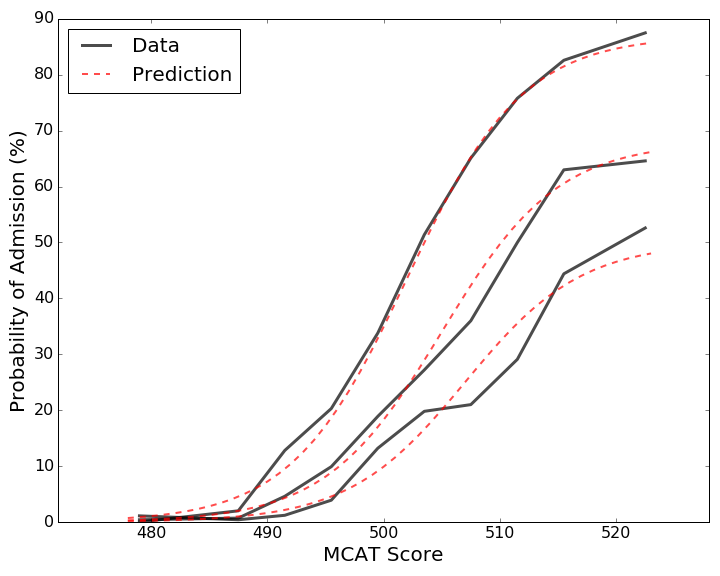
Here we took the three Admit Rate vs. MCAT curves from the last section and chose (carefully) some sigmoids to best fit this data. The sigmoid fits are shown with a red dotted line. Recall that the three curves represent High, Medium, and Low GPA bands. We see that at least for the high GPA band, our prediction is almost prefect. As we get to lower GPA bands, the prediction is not as strong but still captures the dynamics of the data.
Using the fact that our model seems to predict well for higher values of GPA, we will limit our prediction to applicants whose GPA was 3.1 and higher. We also limit our prediction to applicants whose MCAT score was 492 or higher, to reduce noise from lower MCAT applicants.
A Full Model
All the pieces are here. But we need to figure out how to put them together in order to create an all-encompassing model which, given your GPA and MCAT score, will give a (hopefully accurate) prediction of your chance of admission to medical school in the United States. Seems like a daunting task but let’s list out what we know such a model needs to include:
- Given some fixed value of GPA, the model needs to be sigmoidal for changing values of MCAT score.
- Given some fixed value of GPA, the properties of this sigmoid (slope, offset, etc.) need to change as a function of GPA.
- Given some fixed value of MCAT score, the model needs to be (roughly) linear for changing values of GPA.
- The model will be limited to applicants with a GPA of 3.1 or higher and with an MCAT score of 492 or higher.
Taking all these rules into account, and using some mathematical fitting techniques to minimize our error, we arrive at the following prediction function.
\[p(G,M) = \frac{-1.5 + 0.61G}{1+e^{-0.2(M - 512.75 + 2.5G)}}\]where
\[p = \textrm{Probability of Admission}\] \[G = \textrm{GPA}\] \[M = \textrm{MCAT score}\]Seems complicated! But really, we can ignore the actual numbers and just focus on the main structures in this model.
Sigmoidal in MCAT
Given a fixed value of GPA, the model reduces to:
\[p(M) = \frac{K_1}{1+e^{-0.2M + K_2}}\]where $K_1$ and $K_2$ are just some constants.
We see that this has the form of the sigmoidal function we introduced earlier.
Roughly Linear in GPA
Given a fixed value of MCAT, the model reduces to:
\[p(G) = \frac{-1.5 + 0.61G}{1+e^{K_1 - 0.5G}}\]where $K_1$ is just a constant. At first glance there is nothing linear about this, there is an exponential function involved! But, something to note is that the exponential in the denominator approaches 0 for higher values of G (GPA) since the quantity $K_1 - 0.5G$ will get more and more negative, which drives $e^{K_1 - 0.5G}$ to 0 which drives the whole denominator to 1. All in all, this drives the function to
\[p(G) \approx -1.5 + 0.61G\]which is indeed linear in GPA.
Interaction between MCAT and GPA
We also briefly note the interaction between MCAT and GPA is manifested in the numerator, $-1.5 + 0.61G$ and the exponent, $-0.2(M - 512.75 + 2.5G)$. By fixing a value of G, we fix certain properties of the resulting sigmoid including its vertical stretch and its horizontal shift.
All Together Now!
After all that talk about equations, let’s finally see how the model looks in 3D. We can visualize this since the model is simply a bivariate equation. That is, we can choose points on the x-y plane (GPA-MCAT plane) and map that point up vertically to indicate the admit rate. Thus, we get this admit rate surface.

Here the x axis represents GPA, the y axis represents MCAT score, and the z axis represents admit rate.
It turns out that the Root Mean Squared Error (RMSE) from this model is about 3.8% That is, on average we are 3.8% away from the true value of admit rate across all GPA and MCAT values. Not too bad!
So How Does a Prospective Med School Student Use This?
So we have a fairly accurate model to predict admit rate given just GPA and MCAT score. How does a student who is trying to optimize her chances of medical school admission use this tool?
Let’s say you are a student at some point in your academic track with a GPA of 3.4 and an MCAT score of 512. Your natural question should be “Should I dedicate my time to boosting my MCAT or my GPA?” After all, you still only get 24 hours in your day.
A natural way to answer this question would be to focus on the one which gives you the greatest admit rate boost. If that seems like a strange notion, pretend you are a student in a more extreme situation. You are a student who has a GPA of 3.96 and an MCAT score of 485. It really doesn’t make sense to spend all of your free time studying for exams and trying to boost your GPA when it is already so high. It especially doesn’t make sense given that your MCAT score is below the median and might seriously impede your chances of admission if you don’t work on it.
So, the question is, how do we measure the admit rate boost from an increase in GPA vs an increase in MCAT score?
We can do this pretty easily if we take a look at that surface above and treat it as a kind of ‘hill’. That is, our goal is to climb higher and higher on that hill since that implies reaching higher and higher chances of admission. Pretend you’re standing on that hill at some point and want to know the best way to gain some altitude. You can see what happens to your admit rate by taking a few steps in the GPA direction and then what happens to it when you take a few steps in the MCAT direction.
We just need to be a bit careful here when we say few steps. We note that GPA has a range from 0.0 to 4.0 (length 4) while MCAT has a range from 472 to 528 (length 56). In lieu of any detailed information about the relative difficulty of GPA gain vs MCAT gain, we make the simplifying assumption of matching a 1 point gain in GPA with a 14 point gain in MCAT (since 56 divided by 4 is 14).
We show the table of predicted admit rate values for some intervals of MCAT and GPA below with relative GPA and MCAT step sizes determined by the scaling factor of roughly 14 discussed above.
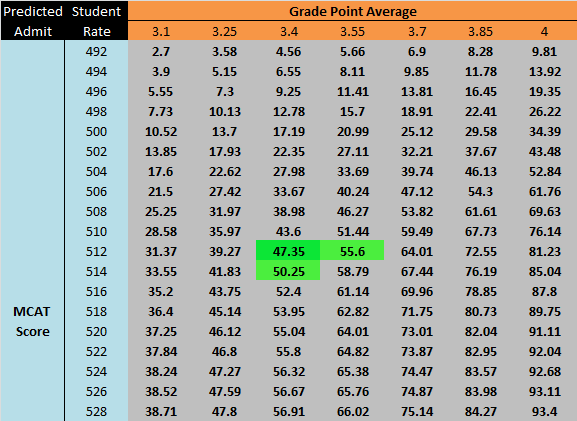
Using this table, suppose you have a GPA of 3.4 and an MCAT score of 512. What is your best move? Well, currently, your chance of admission is 47.35%. If you increase your GPA by a bit, your chance of admission jumps to 55.6% while boosting your MCAT a bit boosts it only to 50.25%. Thus, you should focus now on your GPA. Indeed this makes sense since your MCAT score is fairly above the median of 500, but your GPA could still use some work.
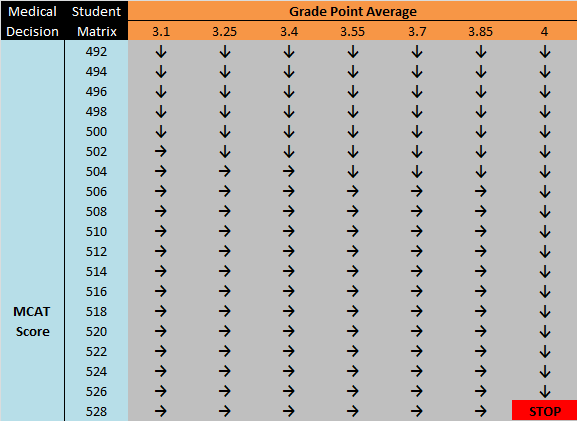
We can do this analysis for every cell in the table and reduce that decision to either a right arrow, indicating you should boost your GPA, or a down arrow, indicating you should boost your MCAT.
We get the result below.
Now suppose we are a student with a GPA of 3.4 and an MCAT of 494. We can carve out a path to success (higher and higher admit rates) by following the arrows starting at the initial state.
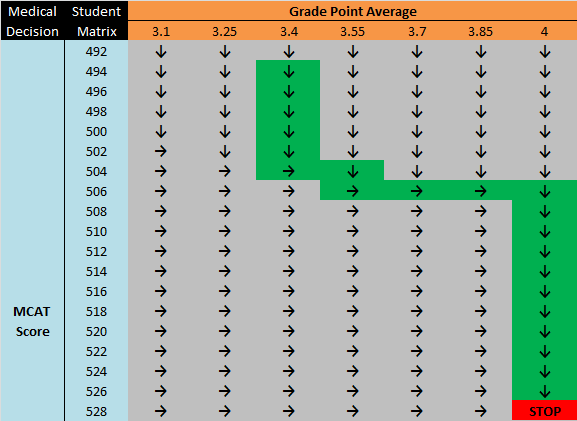
We can do this for any combination of GPA and MCAT score. Just start at the initial state and follow the arrows to find an optimal path through the GPA - MCAT space.
To recap
We used raw admission statistics to capture trends between GPA, MCAT, and Admit Rate
We build an accurate predictive model to extrapolate the admit rate for any combination of GPA and MCAT score (within a specified range)
We used this predictive model to suggest a course of action for prospective medical students based on their current standings.
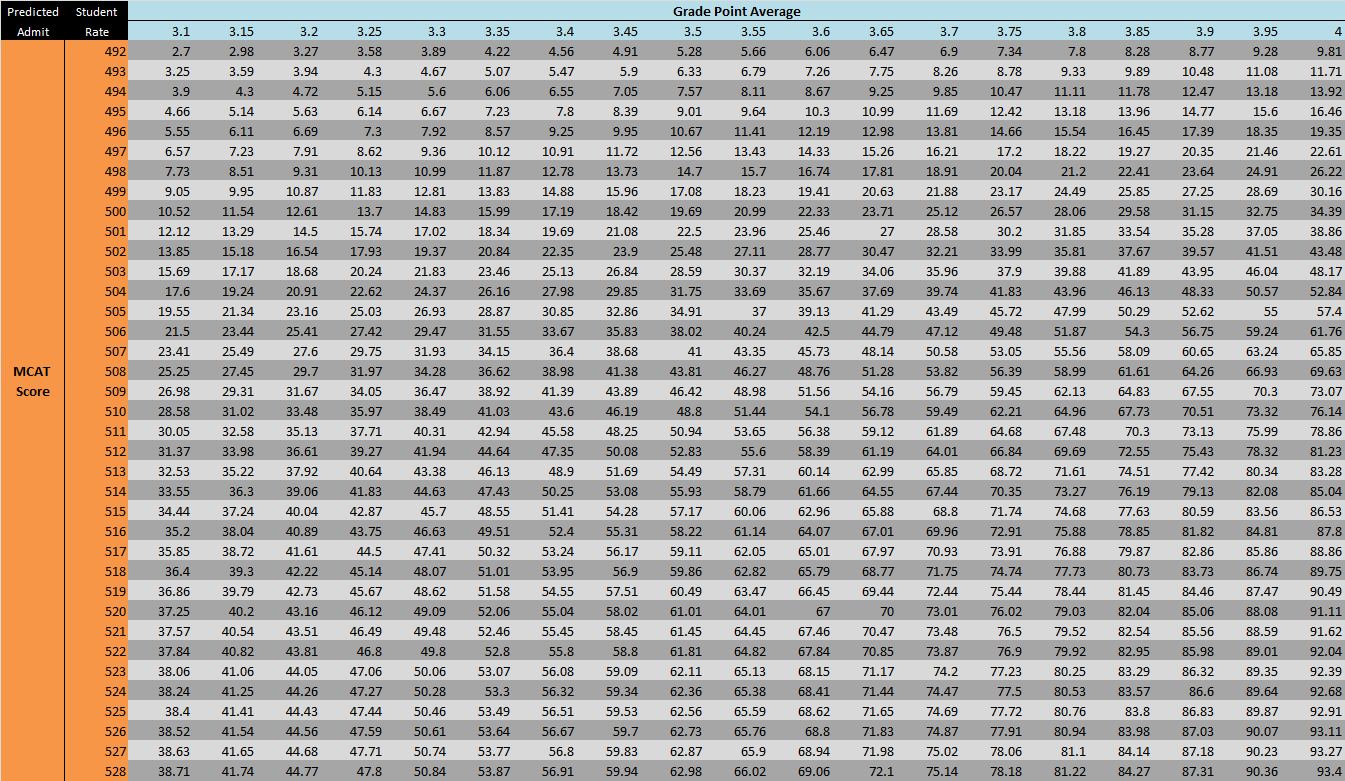
To finish, we show a much more fine grained table of values from the predictive model. You might need to click on it and zoom!.
Lastly, note that if you look up your GPA and MCAT and find the percentage to be not so high, you don’t necessarily need to stress! Why? Because first, this is a model which has some error (3.8% RMSE). Second, this doesn’t take into account other admission criteria such as extracurriculars, gender, race, etc., which have an impact as well. So, use this as more of a benchmark than an end all prediction. Best of luck!
Thanks for reading and please leave comments below!