
Uncovering The Forces Which Break Up Relationships

Quick Links:
- Motivation
- The Data
- What are Commonalities within Dating vs. Married Couples?
- At What Age Do People Meet their Significant Others?
- Where Do Couples Meet?
- How Far into the Relationship is a Couple Most Likely to Break Up?
- What are the Breakup Rates Based on Race, Religion, etc.?
- How Likely is a Couple to Break Up Based On Where They Met?
- Can We Build a Model to Predict Breakup?
- Conclusions
- Notes
Motivation
Romantic relationships, including their formation, continuation, and dissolution, are often perceived as mysterious processes eluding rationalization. Indeed, so some extent they surely are, but in another light, there must be underlying statistical trends to these processes as there are for all of the world’s other happenings.
By getting to the root of the trends underlying the dissolution of romantic relationships, we can understand the main factors that lead a couple to break up or not break up. Then, given these factors, we can begin to build a model designed to measure the strength of a romantic relationship. We can then use this strength measure in predicting whether or not this couple will dissolve within some specified future period.

The Data
The data used in this analysis comes from the Stanford University Social Science Data Collection and is cited in the Notes section. This is a dataset containing individual level survey answers from a sample of 4002 adults in the United States. It contains a great variety of columns which range over a multitude of personal questions about the person and their current relationship and questions about their significant other, if they have one.
What makes this data extra valuable is that there were follow up surveys of these individuals in the subsequent years. That is, the original survey took place in 2009 and was followed by a second wave in 2010, a third in 2011, a fourth in 2013 and a final fifth between 2014 and 2015. This adds a great depth of value because we not only get a static snapshot of the survey participants, but also a follow up history. Indeed, it is this time component that allows us to identify couples that broke up and start asking questions about what factors might have been correlated with this dissolution.
See the Notes section for a much more in-depth discussion of biases in the data.
What are Commonalities within Dating vs. Married Couples?
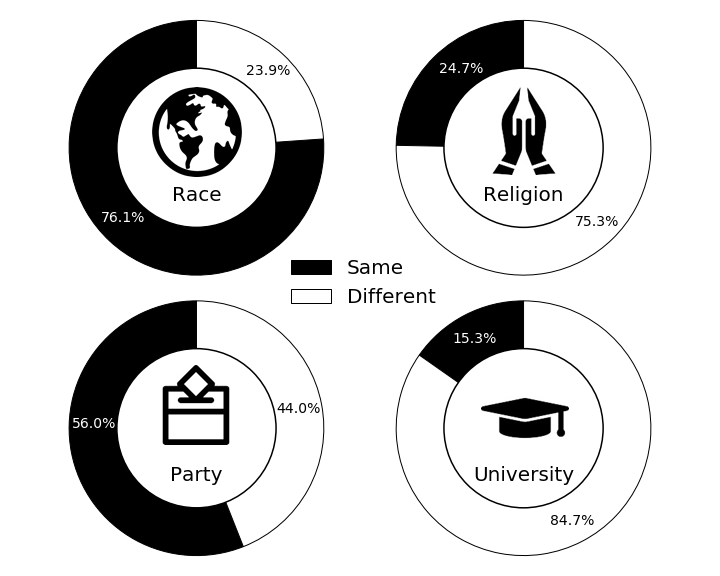
We start by looking at the similarities between two people who are dating and two people who are married. Dating is often perceived as a stepping stone to a long term commitment and eventually marriage. We would thus expect there to be some stronger similarities, possibly even demographically, between married couples compared to dating couples. Let’s look at these similarities on four axes: race, religion, political party, and university.
Dating Couples
Married Couples
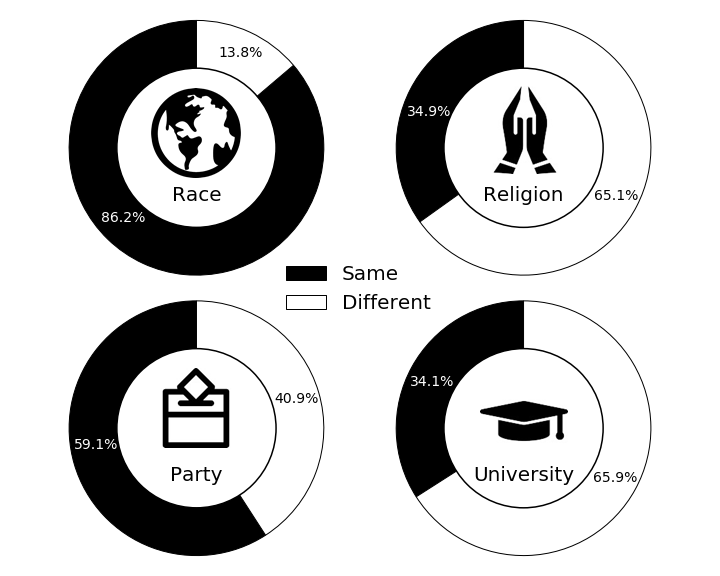
There are some very interesting key takeaways from comparing these two diagrams:
-
More than 3 out of every 4 dating couples are the same race and that proportion jumps by over 10% when we look at married couples. It seems, from these figures, that same-race couples tend to stay together and get married at a higher rate than do different-race couples.
-
The story with religion is similar in terms of proportion increase from dating to married couples but varies in one important way. Namely, whereas most couples were same race, most couples are actually different in terms of their religious beliefs. It is important to note here that the data gets fairly specific when asking about religion so two branches of a major religion are treated as different religious beliefs.
-
Looking at political party, we see that about half of all dating couples share a political party and interestingly, this number does not go up by much when we look at married couples. It seems, thus, that we have some shreds of evidence supporting that political party is not a major factor in couple dissolution. We will come back to that point during the back half of this post.
-
Lastly, we see that for dating couples, the proportion who attended the same university is quite low at just around 15% but when we look at dating couples, this number more than doubles. This is an indication that couples who did not attend the same college or university tend to break up at a higher rate than those who did. This perhaps makes sense due to shared experiences, geographic proximity, etc.
At What Age Do People Meet their Significant Others?
Another question we can ask is at what age people meet their significant other. We first split up our population into four groups: dating males, dating females, married males, married females. We then ask, for each group, when each person met the person they are currently dating / married to, and analyze the results. The histograms below outline the results.
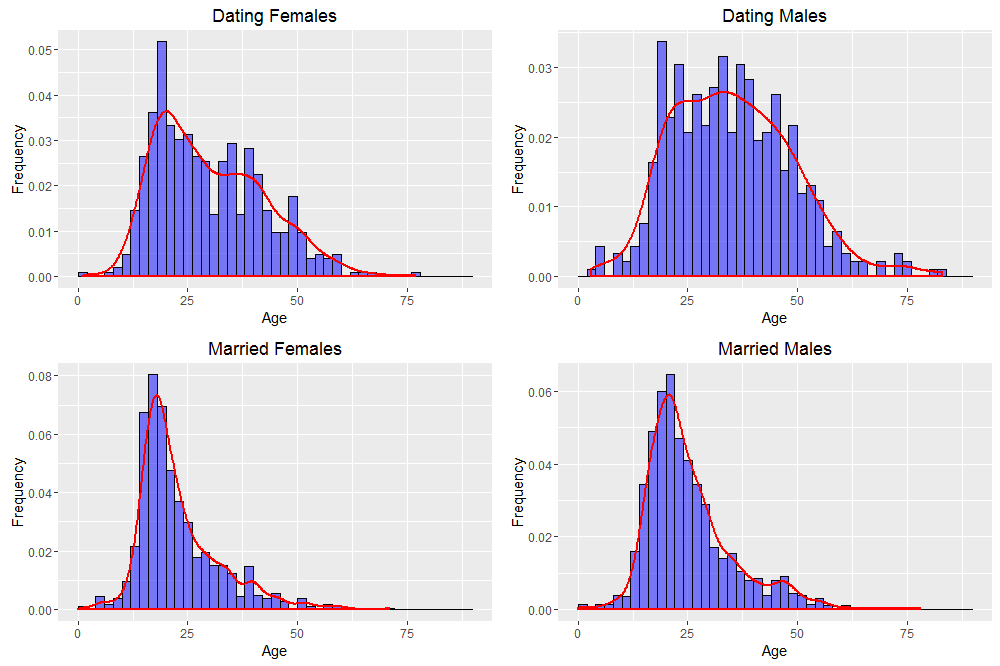
Well, one of these graphs is not like the other three. Let’s discuss the results:
-
Looking just at married couples, we can see the clear difference between females and males is that most females meet their future spouse around age 22-23 while most males meet their future spouse around age 25-26. This is best attributable to the fact that the male is older than the female in a majority of heterosexual couples.
-
We see some really surprising results looking now at the dating population. Namely, dating females have a lower chance of meeting their partner later in life whereas dating males have a higher chance of meeting their partner later in life. We can try to attribute this to the same trend as before, but given the huge difference between these two graphs, there must be some other force at play. One idea is to attribute this to the social stigma against women dating when they get older, a stigma which seems to be weaker towards men dating later in life.
-
There are also some easy-to-miss subtleties in these graphs. It is best illustrated with the Dating Female chart. We see that although the bars decline on average as the age gets larger, there seems to be an up-and-down pattern to the bars. Translating this to real-talk, it seems that the probability of meeting a partner goes up and down through a woman’s 30’s and 40’s. It is unclear, at least to this author, what a possible cause might be. If you have an idea, post in the comments below!
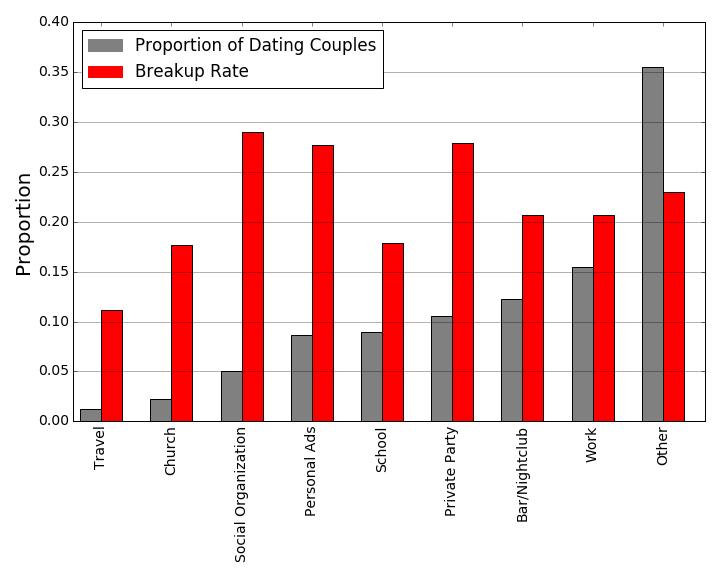
Where Do Couples Meet?
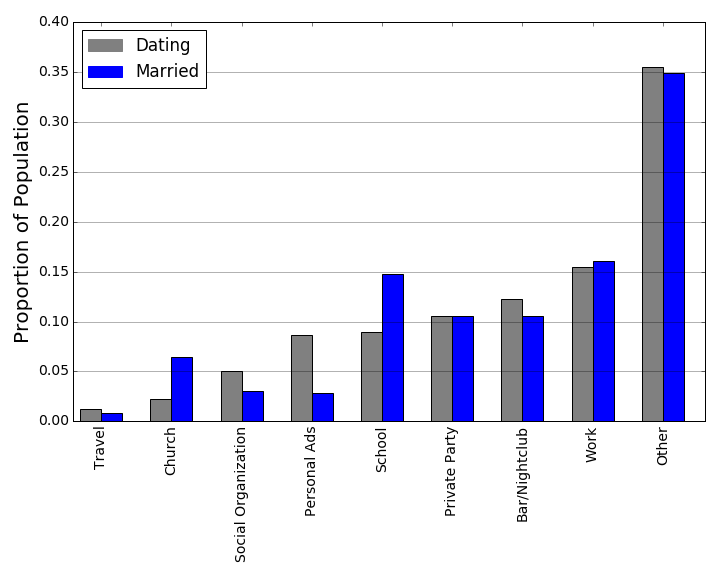
Another question we can ask is where couples tend to meet. We’ve all heard of various ways couples meet including college romances, online dating, and workplace relationships. But, what proportion of relationships fall into each of these buckets? And, to go a bit further, what proportion of eventual marriages started in each of these buckets? Let’s defer to the data.
Cool stuff! :
-
We see that the most popular places to meet a current partner are at work or a bar/nightclub if we ignore the “Other” category.
-
But, the most likely places for an eventual married couple to meet are at work or at school again ignoring the “Other” bin.
-
These two findings together imply something that we will see proof of a bit later on, which is that the locations for which the blue married bar is lower than the grey dating bar should have a higher breakup rate. Furthermore, the relative sizes of these bars should provide an indication of how severe the breakup rate is. Just as one example, not many people meet their significant other at church, but relationships that start there tend to stay together, as evidenced by the corresponding marriage bar being nearly three times the height of the dating bar in the “Church” bin.
Stay tuned for more on this later in this post!
How Far into the Relationship is a Couple Most Likely to Break Up?
This second portion of the post will focus on dissolution rates in dating couples (so we will not consider married couples here). We really want to find out forces make or break a couple so that in the third part of this post, we can use that information to build a predictive model for couple dissolution.
The first question on our minds concerns the tendency for a couple to break up based on how long they have already been together. Now, some of you might be saying, “well obviously the longer they have been together the less likely they are to break up!” Let’s see what the data has to say.
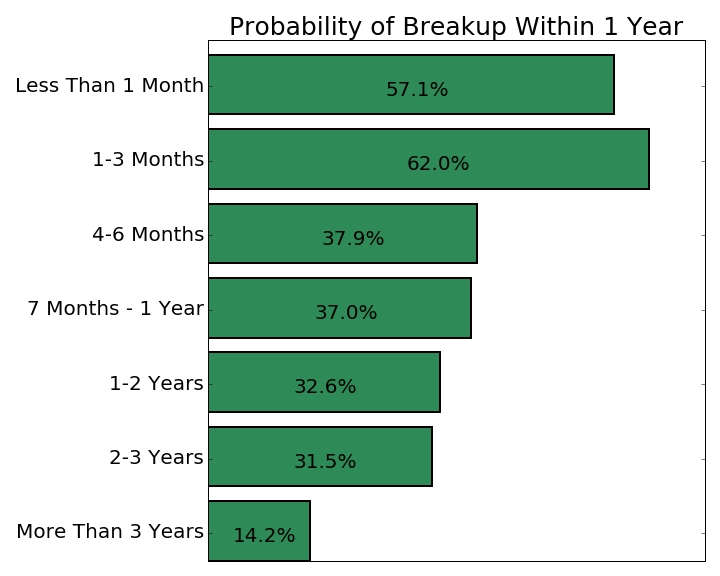
Probability of Breakup Based on Length of Relationship
Hmm … :
-
It seems you were mostly right! The probability of breakup does indeed tend to decrease with the length of the relationship, especially after 3 or more years, where the breakup rate is only at 14%! But, let’s not ignore the elephant in the graph. What’s up with that spike at “1-3 Months” following the lower breakup rate at “Less Than 1 Month”? This author believes this is attributable to the “Honeymoon Phase” where any real problems underlying a relationships have not manifested or are simply buried under the excitement of a new romance. This would explain the jump from the “Less than 1 Month” bin to the “1-3 Months Bin”
-
It is still worth noting though that breakup rates remain well above 50% for any relationship 3 months or newer.
-
Another point worth noting is that the breakup probability goes down by a good 4.4% after the 1 Year mark but the 1-2 Years and 2-3 Years break up rates are nearly identical, indicating some sort of marginal returns to time. That is to say: perhaps the probability of breakup continues to decrease as the relationship progresses, but decreases by less and less for each additional month of dating. Put an even simpler way: The fact that a relationship lasts one year drives the breakup probability down a lot but the fact that it lasts another year after that doesn’t drive the breakup probability down as much. And it goes down even less for each subsequent year thereafter.
What are the Breakup Rates Based on Race, Religion, etc.?
Some of you might argue that the section above was “so obvious” or “predictable”. Well fine, let’s get to the ‘interesting stuff’ about couple dissolution (although the marginal returns to breakup were pretty cool in my opinion).
We will now study how breakup rates differ for couples who are same-race vs. different-race, same-religion vs. different-religion, and met-online vs. met-offline.
Turning first to the question of race:
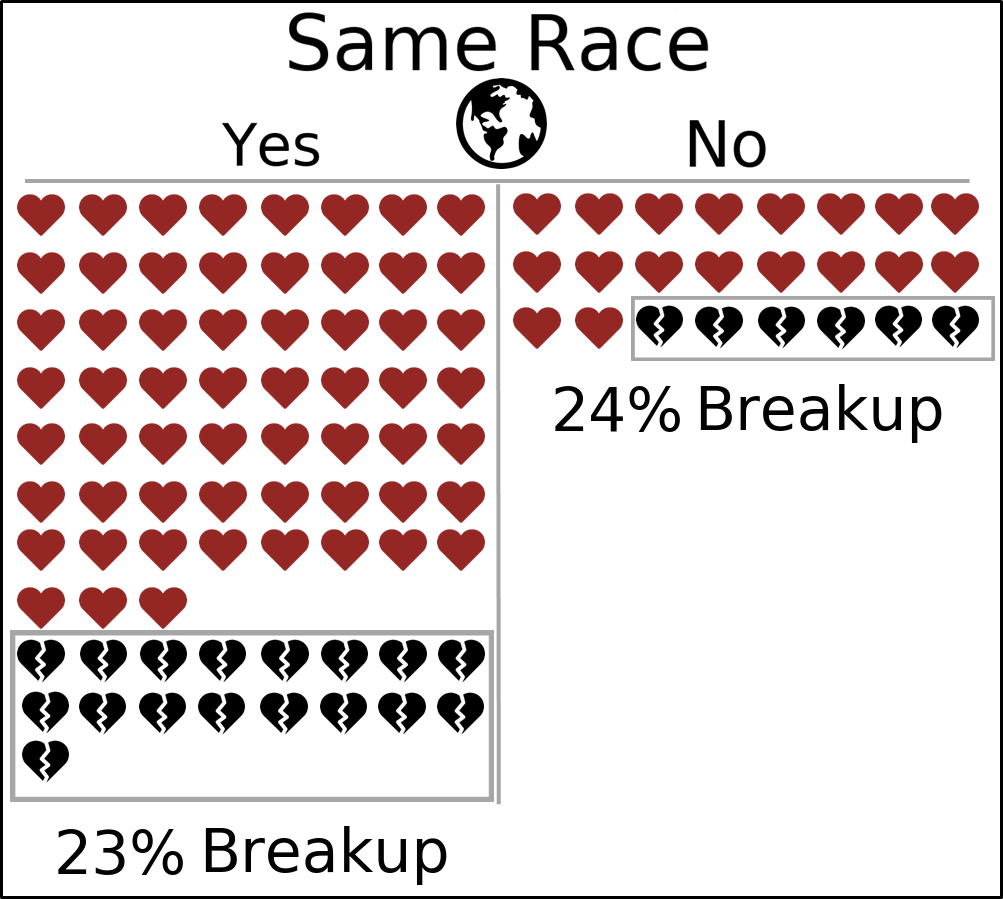
As we saw before and as is shown here, the majority of couples are same-race couples. But, from this figure, it seems like the 1-year breakup rate seems to be nearly identical for same-race vs. different-race couples. Some of you are surely scratching your heads now: Didn’t this author just mention in the beginning of this post that different-race couples tend to break up at a higher rate than same-race couples?
Yes, and these two ideas are not necessarily contradictory because of one important fact: we need to remember that the break up rate we are using is the 1 year break up rate. That is, if some couple stays together for 1.5 years before breaking up, they will be labeled as still together at the 1 year mark we measure. So, putting this all together, it seems that different-race couples do indeed break up at a higher rate than different-race couples but the different-race couples that do break up tend to stay together for at least one year.
Let’s switch our axis from race to religion:
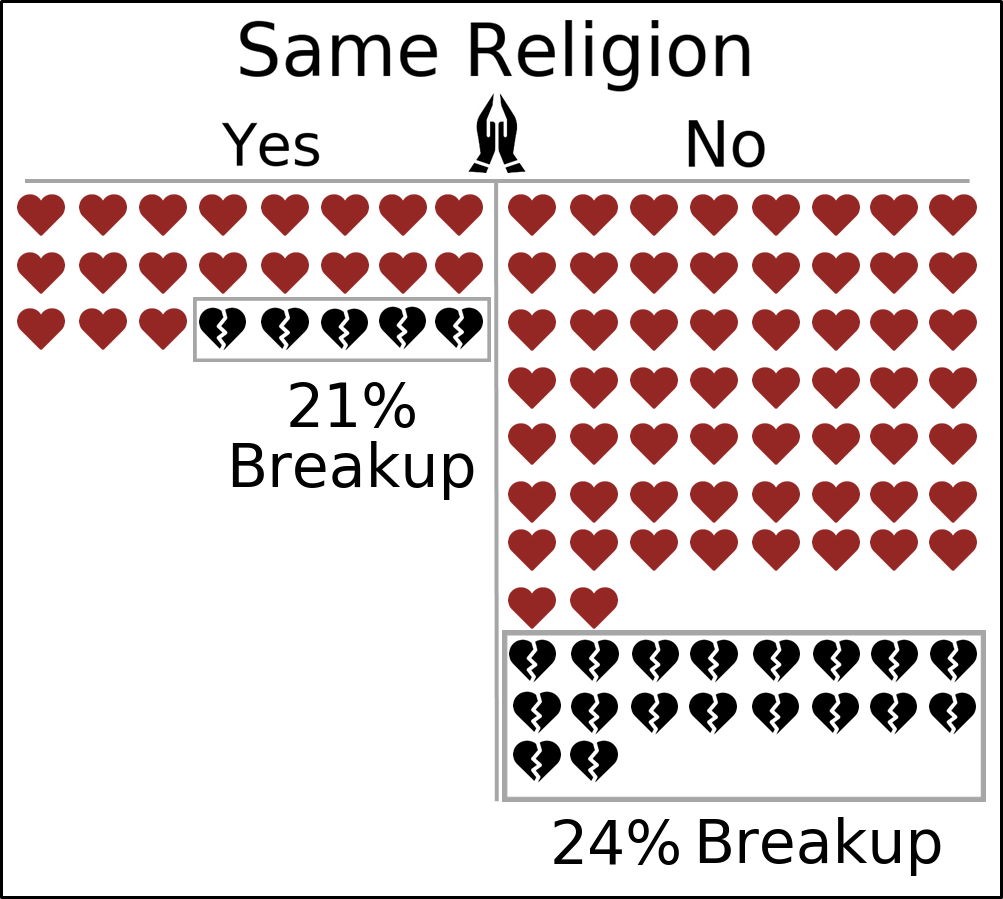
We see here that the disparity between breakup rates gets a bit bigger. Namely, a different-religion couple is 3% more likely to break up within a year than a same-religion couple. It would be a bit hasty, armed with only this statistic, to conclude that religion is a larger factor in couple dissolution than race, and we will indeed see evidence to the contrary when we start building a predictive model in Part Three of this post.
Now, let’s look at a form of dating that has gained popularity during the last few years: online dating. Indeed, the online dating phenomenon including dating sites like Match.com or OkCupid.com and mobile apps like the (in?)-famous Tinder, has taken the world by storm, introducing a totally new way to meet others. But, what does the data say about the stability of these relationships in the one-year horizon?
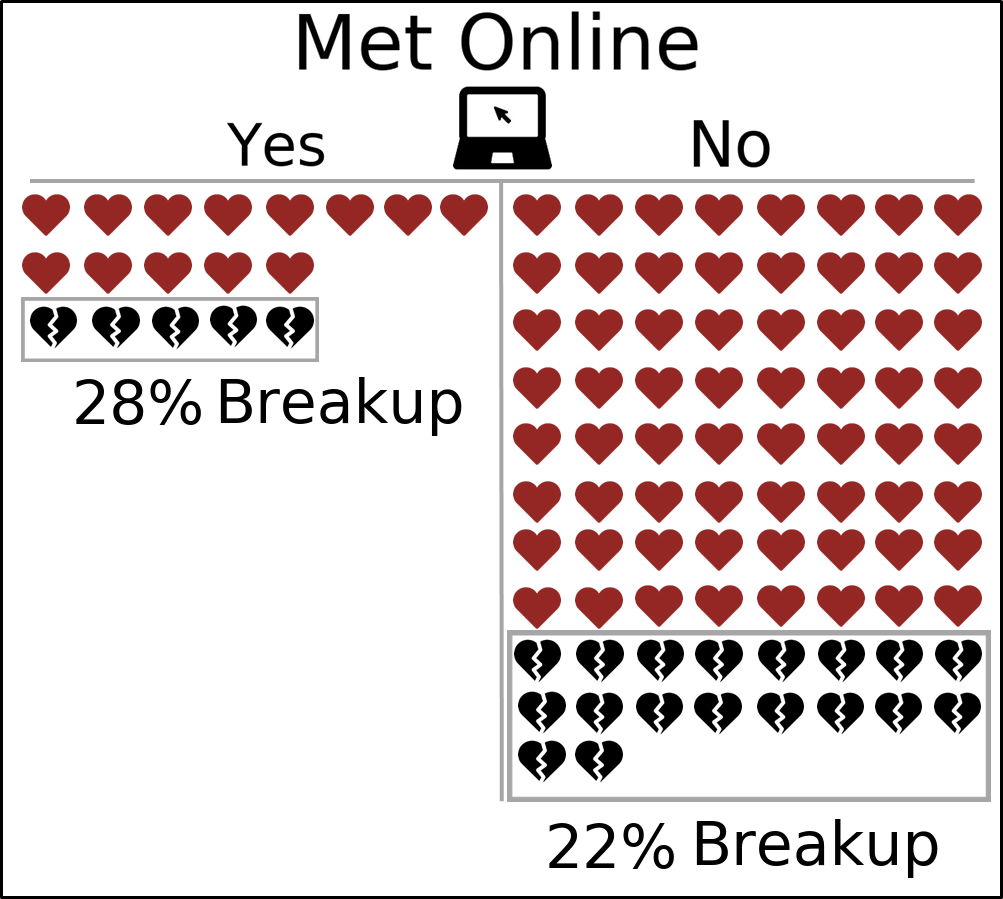
The thing that probably first caught your eye is that only 18% of couples actually meet online and the second thing that surely caught your eye is that the couple dissolution rate for met-online couples is 6% higher than that of met-offline couples (Met offline is just this author’s way of saying couples that did not meet online).
Just let that sink in for a second. That means that for every 10 couples that meet online, about 3 break up within 1 year. Whether these proportions will change as the future progresses and online dating becomes more (or less?) popular is up to debate. Leave your thoughts in the comments below!
How Likely is a Couple to Break Up Based On Where They Met?
Remember when we looked at where dating couples and married couples met? Well, it’s time to revisit this topic as promised. We now want to ask the natural next question, which is “How likely is a couple to break up within one year based on where they first met?” Indeed you might have your own preconceived notions of the disparities in the break up rate.
Do you think couples who meet in a bar/nightclub are more likely to break up than those who meet at church? Do you think that couples who meet at school are more or less likely to stay together than those who meet at work? Rank these breakup rates in your head before looking at the story the data tells below!
Ready? 3..2..1..
How did your ranking match up with the results?
We can roughly split up the categories into high, medium, and low breakup rates:
High Breakup Rate: Social Organization, Personal Ads, Private Party
Medium Breakup Rate: Bar/Nightclub, Work
Low Breakup Rate: Travel, School, Church
-
It is maybe surprising that Bar/Nightclub and Work have nearly identical breakup rates, especially given the previous figure on where Dating and Married couples meet. But, we need to again remember that these are only 1 year breakup rates and say little about what happens thereafter. For a further explanation of this phenomenon, see the discussion on biases in the data in the Notes section.
-
We see from the “Low” bin that the most stable relationships (at least at the 1 year cutoff) begin at school, at church, and surprisingly during travel. It would be interesting to see, perhaps in a later iteration of this work, if these low breakup rates persist at the 2-year, 3-year, etc. cutoffs.
-
This author found it curious why the breakup rate for social organizations was so high compared to all the other bins. Is it that these relationships are somehow tied to the organization so that when one or both parties leaves, the relationship tends to dissolve? Is it that a social organization is not as much of a commitment on average than school or church? These are all just hypotheses, what do you think?
Can We Build a Model to Predict Breakup?
Finally, we are here. It is time to use all this knowledge we have amassed about relationships and the forces that cause them to dissolve or persist. We will now turn our attention to building and analyzing a model which will help us predict which couples will break up and which will stay together after a year.
Methodology
This author would like to be very transparent with the assumptions underlying this model in the interest of proper interpretation. Indeed, this author sincerely hopes that the model we show below is not some kind of be-all and end-all indicator for whether a couple will break up in a year. See the Notes section for a further discussion.
-
Define Our Features: In the field of machine learning, features are defined as the predictors we hope to use in determining the value of some measure with some high accuracy. In this case, they are the attributes of couples that we will be using to assign a 1 or 0 label indicating that they will or will not break up within a year. We will use many of the features outlined in this post including: length of relationship, where a couple met, whether a couple is same-race, same-religion, same-political party, etc. We will also use some features from the data that we did not explicitly mention above including: years of education of both people in the relationship, whether both people are from the same town, whether they have the same employment status, how long ago the romance began between the two, and the age difference between the two.
-
Training and Testing Sets: We need to split our data into what is called a training set and a testing set. The idea is fairly simple. We will build our model using the data in our training set and test for the accuracy of this model on our testing set. It is crucial that these two sets do not share any data. Confused? It’s OK! Let me explain using an example. Imagine you are preparing for a final exam using past final exams by this professor. It is crucial, at least for the professor, to use completely different questions on the actual final exam than those on the final exams you use for practice. Otherwise, the actual final exam will not measure student performance but rather just how well you can memorize questions. It’s basically the same idea here.
-
Model Selection: Once we define our features we will need to figure out which type of model is best in giving us a high accuracy. This is often referred to in machine learning as model selection. In practice, we will iterate over many different types of models and combinations of features and pick the one which gives us the best accuracy on our testing set.
-
Measuring Performance: If we get a model that is 75% accuracy in predicting whether a couple will break up in a year, is that good? Actually no and here’s why. It turns out that about 24% of couples break up within one year. So, let’s say that instead of using our model, we just predict that each and every couple will not break up in a year. What is our accuracy? Well, 76% of couples do not break up within a year, so our accuracy will be 76%, already higher than the 75% we got with our hypothetical model. Basically, if we do not get higher than 76%, we might as well just guess randomly and throw away our model. How embarrassing would it be to get a 30% on a True-False test where you could have gotten 50% by random guessing?
This is the basic methodology behind our predictive model. After searching through various combinations of features and models, we find that the best model is one called a Random Forrest Classifier. Without going too deep into the details, this model basically asks a series of Yes-No questions based on the importance of the feature. For example, it might ask as a first question “Is this couple same-race?” and as a second question “Is the age difference between this couple greater than 3 years?” because the first question gives more information than the second (hypothetically of course).
We can now look at how accurate our model is compared to the Baseline random guessing we described above. Let’s take a look!
The Strength of Our Model
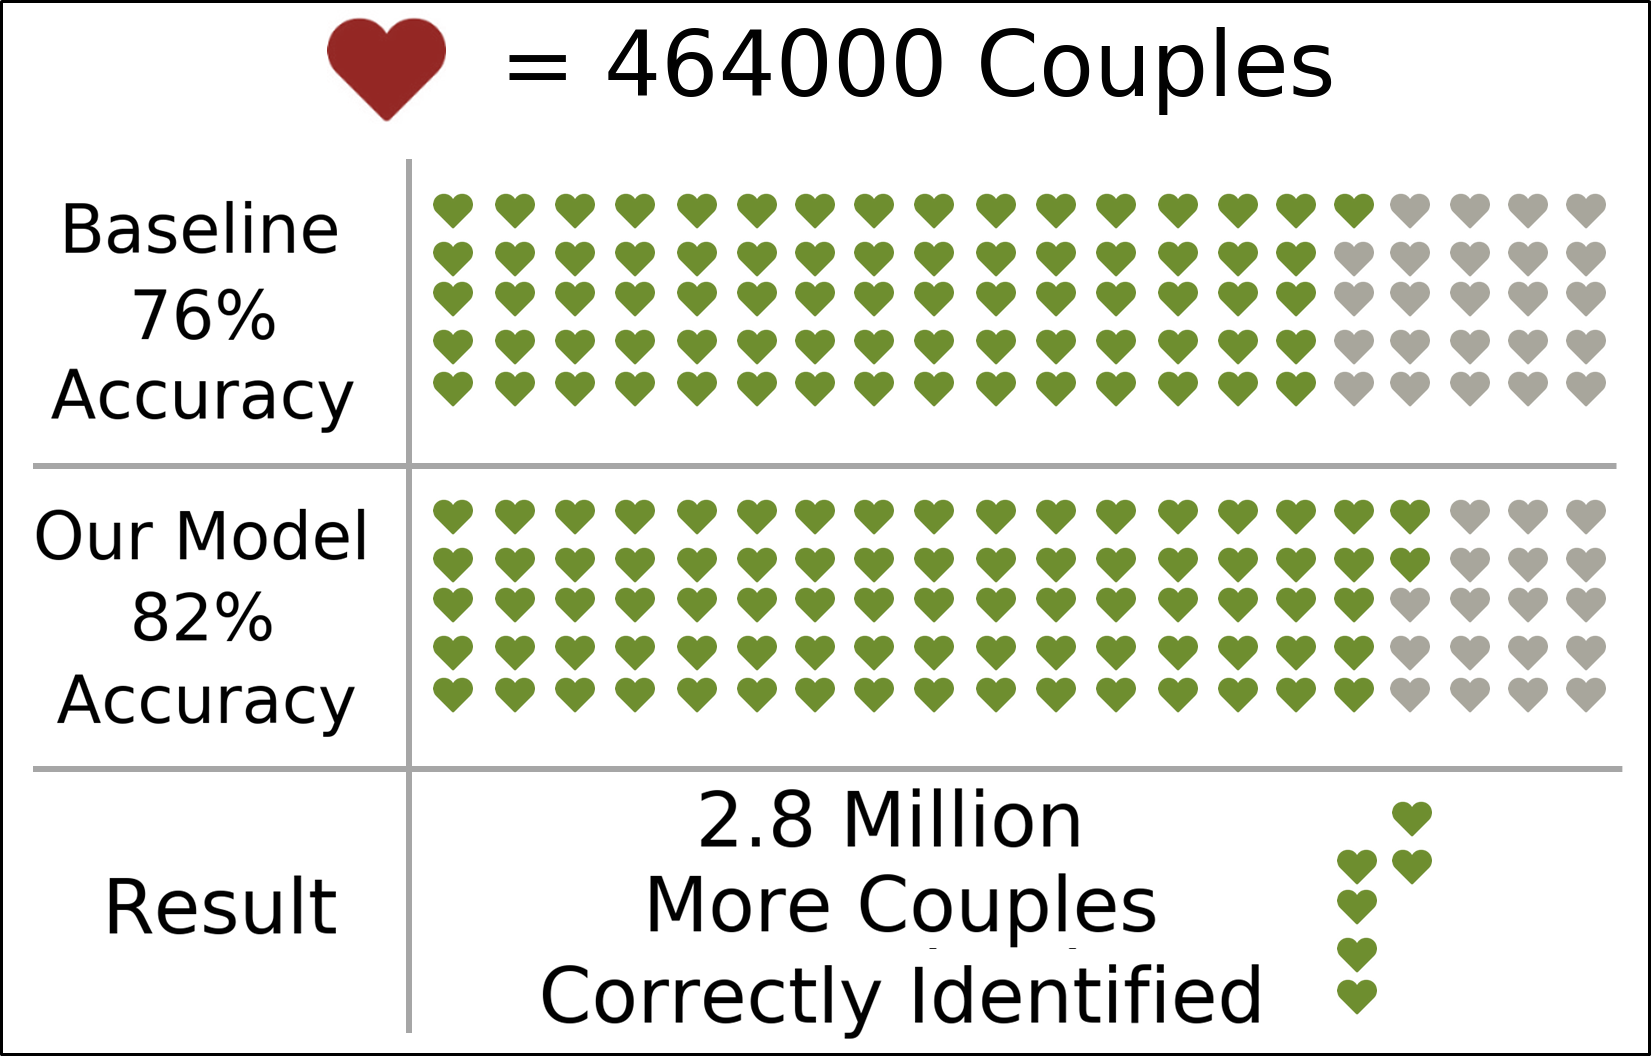
Wow! It might seem like those 6 additional hearts we gain from our model are measly, but look again! Considering each one represents 464,000 couples, it turns out that we classify an additional 2.8 million couples correctly compared to the random guessing model!
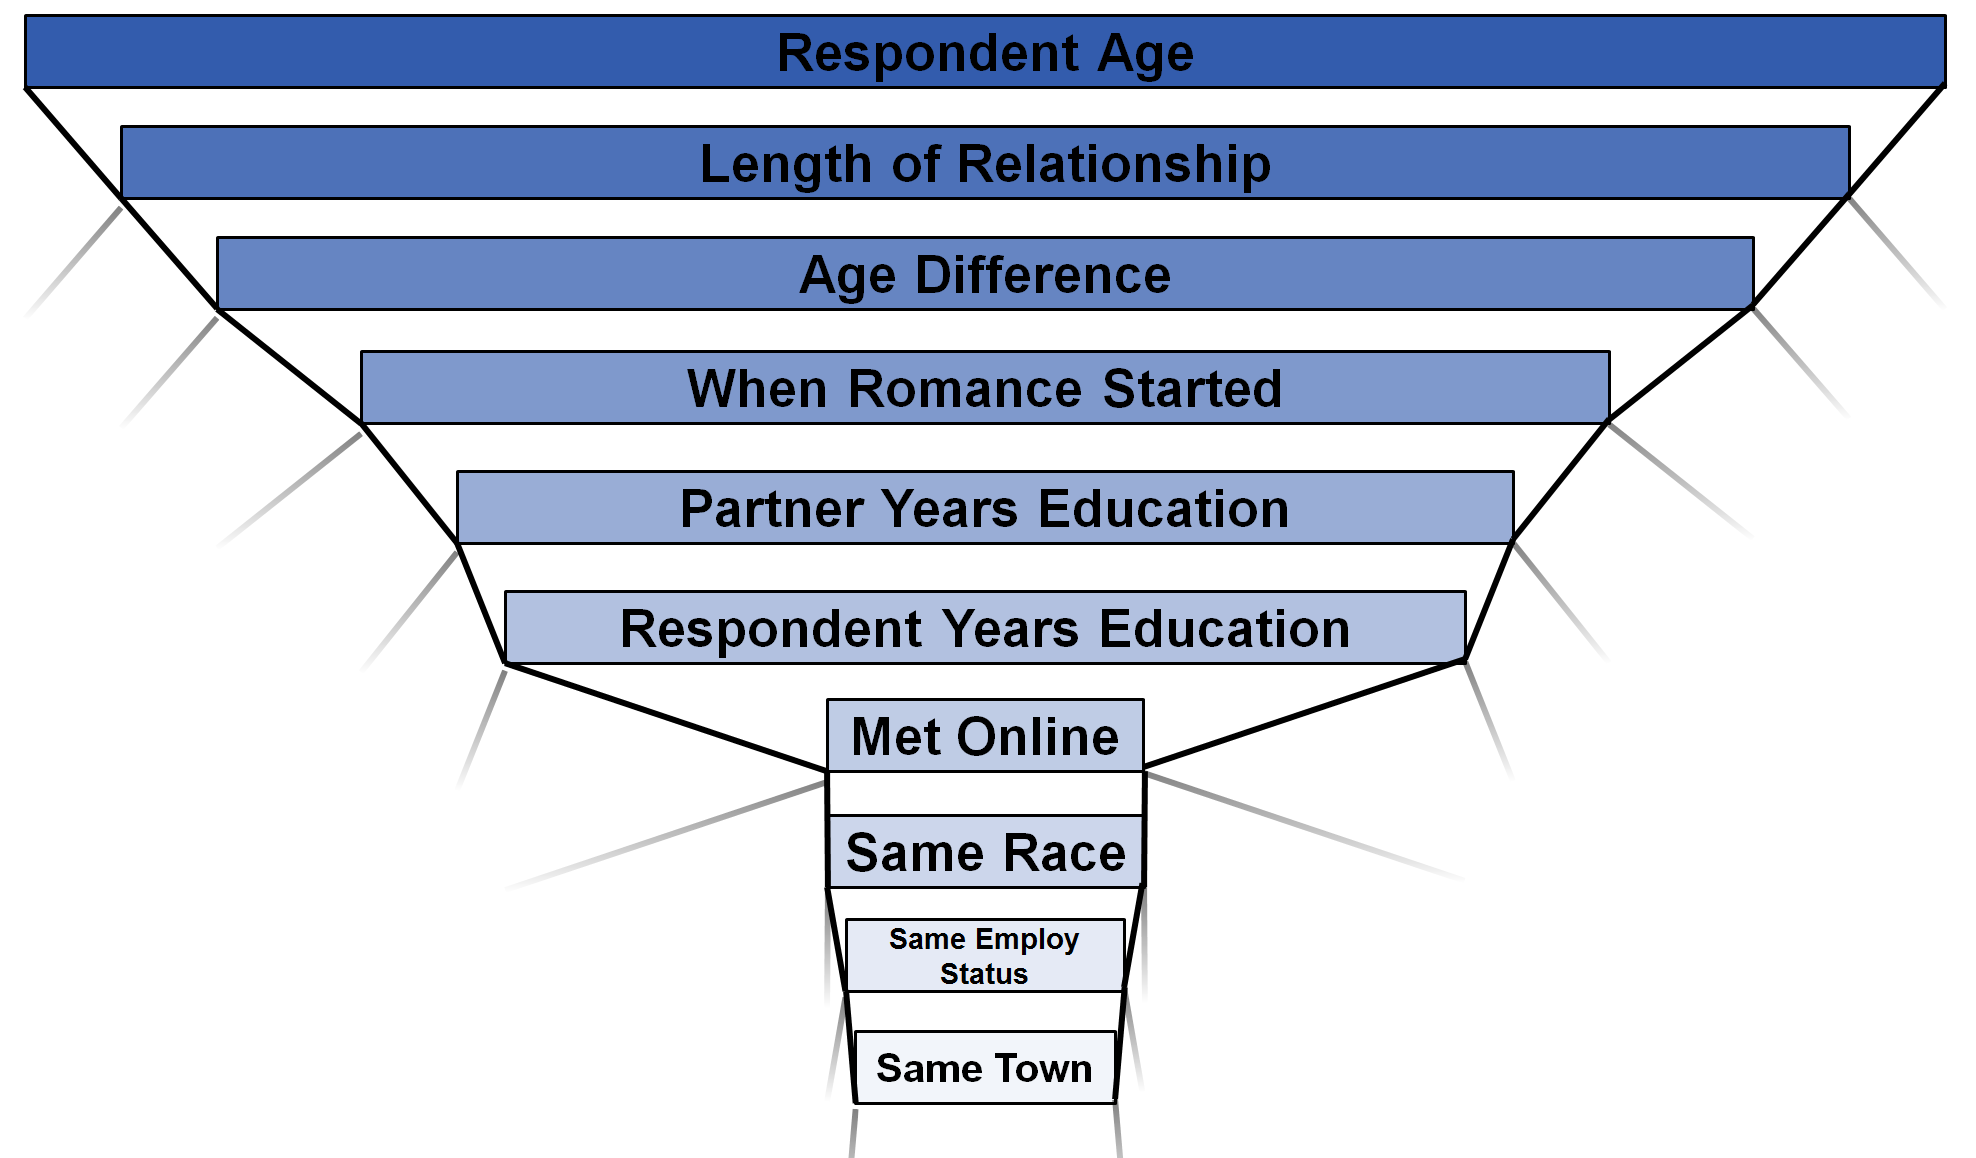
Now the question we (or at least I) have been waiting to answer: What are the best predictors of whether a couple will break up in the next year? Here they are:
Feature Importances in Our Model
-
We see, maybe surprisingly, that the respondent age is the best predictor of couple dissolution. And from analyzing the data, we see that this correlation is a negative one. That is, the older someone is, the lower the chance they break up with the person they are dating. This author might attribute that to the fact that younger people “date-around” more often, something that is less of a phenomenon with older adults.
-
Other big predictors are length of relationship and age difference and when romance started. It is important to note that these, along with the respondent age are all categorized by time, as opposed to something like same-race, which is time independent. (sidenote: It was hard for this author to define exactly what when romance started means but, in terms of the data, it is usually, not always, an event that occurs after the relationship starts, so the best guess is that it is some indicator of when this person started “going steady” with their partner. Might be worth digging into a bit more.)
-
Next come a lot of (at least somewhat) time-independent factors such as years education, met-online, same-employment, same-race, and same-town. By time independent, this author means that these are features that don’t strictly change over the course of a year. Indeed, employment status, or years of education might change over the course of a year, but something like respondent age will change over the course of a year.
-
A final note on this chart is the relative sizes between our predictors. Namely, we see a pretty uniform decline in predictive power up until respondent years education and then a sudden decease when we consider met-online. Perhaps then the features on years of education do belong more in the “time-dependent” category. Of course, this is all assuming that this time dependence is actually a natural separator for predictive power.
Conclusions
Wow! That was sure a lot. Maybe some of you are feeling good about the state of your relationship (or maybe the prospect of one) based on the findings above. Maybe some of you however, are feeling defeated or trapped in some sort of “statistical destiny”. I speak now directly to you.
Love, as much as I have tried in this post to capture the trends and correlations underlying it, is not something that can so easily be understood. As someone who has himself once been in a different-race, different-religion, long-distance relationship, I understand that love is something which thrives on communication, understanding, support, and compromise, none of which are captured in the data (as if you could capture such things).
So, it is important to take the findings above with a grain (or a barrel if you prefer) of salt. The work above is very useful, enlightening, and surprising in understanding the disparities in breakup rates based on a variety of factors pertaining to couples, especially in regards to those things people fundamentally identify with such as race, religion, and politics. Still, remember that these disparities have an inherent “all else held constant” phrase. Even if you are a different-race, different-religion, different-party, etc. couple, if you have found some common ground, good on you.
The important thing, I think, is really to build the courage to understand what you truly want and find the person, go to the place, achieve the goal, cross the barrier that will help you get there.
Notes
There are many things worth noting about the data we are using. These are important to keep in mind while reflecting on the above analysis.
-
The data was collected through a survey, which means that it was opt-in. That is, this survey was sent out to many Americans, and the 4002 people that replied are reflected in the data. It is important to keep in mind that this self-selection can cause inherent biases in the data. It is a common trend that self-selection can attract people who are more extreme in some aspect than the average person. Just as an example, when giving teacher evaluations, the students who really enjoyed the teacher and those who really despised the teacher will tend to respond while those who have no real preference will tend not to respond.
-
Since this survey was given to the same group of 4002 people for multiple years in a row to see if they have broken up with their partner or divorced their spouse, or if their partner/spouse had passed away, fewer and fewer of these people replied with each successive wave. For example, in the initial wave consisted of 976 people who were dating. In the second wave, only 875 of these people updated their dating status (a 10% participation loss). Then in the third wave, only 568 of the initial 976 gave a status update (a 35% participation loss from wave 2). It just gets worse from there. This is why we use the 1 year breakup rate in this work. If we looked at breakup rates after 2 and more years, we start having to reduce our sample by more and more. (Not to say this isn’t worth looking at).
-
This data was fully self-reported. That is, no one went and fact checked whether this person was truly the age, race, religion, etc. they claimed to be. Furthermore, there was definitely no check on the details about their partner since we do not even have a name or way to contact this person. Given this, along with the fact that some of these questions were very personal, we have a pretty good chance of running into some biases in the data. For example, if you ask this author, the one year breakup rate calculated from the data, 24%, is much too low. The reasoning is that given the chance to answer fully anonymously whether a person is still in a relationship, many people might be inclined to answer “yes” even if that is not the case. One reason alone might be that they just recently broke up with this person and there are lingering feelings. Or perhaps they are just “on a break”; relationships don’t always fall into that dating/not dating split. Other fields could easily be biased up or down too including age, salary (we didn’t touch on this but is was in the data), education level, etc.
-
Some of you might be wondering why we did not touch at all on same-sex couples vs different-sex couples. In fact, this was one of the key goals of this author, but there was a major problem. The data source states that “The study oversamples self-identified gay, lesbian, and bisexual adults”. Indeed, if we compute the proportion of such adults in the data it is around 20% which does not agree at all with the national true value of around 4%. Given this fact, this author thought it would not be wise to report likely false population-level findings given a highly skewed sample.
-
There was of course a missing data issue throughout the course of this analysis, since we cannot expect that every one of these 4002 people answered every question. The way this author dealt with that was twofold. The first was to only use features which contained answers by over 85% of the sample. This was to avoid using a feature where only 50% of people gave an answer, which might lead to severe or more severe selection bias than we already have. The second way was to drop all rows with even one missing value after subsetting to only look at features where over 85% of the sample gave an answer. It seemed that the missing values were correlated (people who did not answer one question tended to not answer other questions and vice versa), so that this kind of data filter did not greatly diminish the size of the dataset much further than the 85% limit would have.
Data Citation:
Rosenfeld, Michael J., Reuben J. Thomas, and Maja Falcon. 2015. How Couples Meet and Stay Together, Waves 1, 2, and 3: Public version 3.04, plus wave 4 supplement version 1.02 and wave 5 supplement version 1.0 [Computer files]. Stanford, CA: Stanford University Libraries.
Thanks for reading and please leave comments!