
Analyzing the UCLA Swipes Black Market
Black Market Economy
Disclaimer
The purpose of this post is to analyze, elucidate, and understand the market for UCLA Dining swipes through the years. The author DOES NOT endorse the selling of swipes as this is a clear violation of UCLA On Campus Housing Regulations, Section C.7.a, copied below:
The only person authorized to use a UCLA Dining Meal Plan card is the owner of the card. UCLA Housing and Hospitality Services is the sole vendor of meal plans and dining meals. Dining Plan meals are non-transferable. Meal plan holders may not pass, loan, trade or sell meals or their ID card to anyone for any reason.
Quick Links:
- Motivation
- The Data
- What is the activity of the swipe market over time?
- Where are buyers eating?
- How much does UCLA Dining lose?
- How much is a swipe worth throughout the year?
- So What?
- Notes
Motivation
Background
At UCLA, students living in the residential dorms use a unit of currency called swipes, loaded onto their student IDs, to get access to dining halls and quick service restaurants.
There are two fundamentally different meal plan styles that students are able to choose from, standard and premier.
Standard meal plans allocate a set number of swipes at the start of each week (11, 14, or 19), and allow the student to swipe at most one time per meal period (Breakfast, Lunch, Dinner, Late Night). All unused swipes at the end of the week are lost and the student will be allocated another set of swipes at the start of the following week.
In contrast, premier meal plan holders pay a cash premium which gives them increased flexibility in using their swipes. For example, a student who has meal plan 14P (P for premier) is allocated 154 swipes (14 swipes per week for the 11 weeks of the quarter) all at the start of the quarter, with no restriction on when or how many swipes s/he can use per dining period. One reason students often elect to purchase this premier plan is to allow for guests to enter dining facilities with them.
The Problem
All too often, students who purchase premier meal plans find themselves with an extreme surplus of swipes with no chance of using them all by the quarter’s end, when all remaining swipes are lost. Faced with this situation, students elect to sell their remaining swipes, and there is more than enough demand in this black market for swipes. Students living off campus, without access to a meal plan, make up a large chunk of the consumers in the market for swipes.
With an adequate number of suppliers and demanders for any product, a structured market is bound to arise. This market for swipes will be the focus of analysis for the remainder of this post.
The Data
Data for this analysis was scraped from a Facebook group designed to connect buyers and sellers of swipes. The data, consisting of ~17000 posts ranging from 2013-2016, includes fields such as when a post was written and the content of the post.
We see a snapshot of the data below:
The crux of the following analysis relied on a careful and methodical extraction of various fields from the text portion of each Facebook post. In particular, the following features were extracted from each post: whether the post was by a buyer or seller of swipes, how much the post’s author aimed to buy/sell swipes for, how many swipes the author (typically in the case of a buyer) wanted, and which dining facility the author wanted to buy/sell swipes for.
This all boils down to a problem in Natural Language Processing (NLP), the art of extracting relevant and accurate information from everyday speech. As a gentle introduction to this process, we will look at an easy, medium, and hard post to extract information from.
Easy Case
buying 3 swipes at De neve at 12, $5 each, PM me~
We wish all posts were as easy to analyze as the one above. This post is nice for many reasons including:
- The post clearly starts with ‘buying’ indicating that this person wishes to buy a swipe
- The post clearly mentions that ‘3 swipes’ are needed
- The post clearly mentions the name of the dining hall, De neve dining hall
- The post uses a ‘$’ symbol and the word ‘each’
Medium Case
Anyone need Late night Swipes? I have 7 swipes i got to get rid of. $5 - Los Angeles, CA (90024)
The post above is more confusing for a few reasons:
- It is clear to human that this person wants to sell swipes, as indicated by “Anyone need … ?” but the word “sell” is nowhere mentioned, making this task more difficult for a computer
- Furthermore, the word ‘need’ is used, which is typically used by buyers i.e. “I need swipes”
- It is clear again to a human that this person is willing to sell 7 swipes at $5 each but the word ‘each’ is never explicitly used which, is not properly checked, might cause a naive computer to believe this author is selling 7 swipes for a total of $5, clearly not the case
- Still we can manage to work this one out with some clever rules such as picking up on the fact that the word ‘need’ is used but that the sentence ends in a ‘?’ or that it is probably illogical for someone to sell 7 swipes at $5 total, yielding a value of less than $1 per swipe.
Hard Case
swipes bplate 1pm, $5 - los angeles california, help me raise money for my friend’s unicamp project! thanks!
This post is very clear to a human but very hard for a computer to understand for a few reasons:
- Even for a human, just reading the first part is a bit confusing. That is, if we just read up to: “…los angeles california” we are not really sure if this person is in need of swipes at bplate (a dining hall) at 1pm or will be selling swipes at bplate at 1pm. We might lean towards selling
- After reading the latter half of the post, it is clear to a human that this person is raising money for their friend’s project and thus must be selling swipes, as we might have suspected. But, this is a very very special case and a computer will find it very hard to pick up on this nuance. For this reason, posts such as these are tagged neither with a ‘b’ for buyer or ‘s’ for seller but rather with an ‘n’ for ‘not sure’, in order to avoid misclassification.
Whew. Enough of all the words, let’s see some graphs!
All this data begs some immediate (and some not so immediate) questions. Let’s ask each one and answer it with a cool graph!
What is the activity of the swipe market over time?
The activity of any economic market, even a black market, relies on supply being available and demand being high. The supply side is easy. Students only have meal premier plans during academic quarters, Fall, Winter, and Spring. So we expect a huge drop (theoretically) down to zero between quarters and in the summer. The demand side is a bit more nuanced. Obviously, students demand swipes mainly during academic quarters but there are more subtleties going on here.
For example, at the beginning of the quarter, students are likely less dependent on buying swipes and have their fridges stocked (with health food for their ephemeral diets). But, as any student knows, when midterms, and especially finals come around, cooking is not a top priority. A potentially cheap all-you-can-eat meal at a dining hall sounds like a great option. Indeed, we expect demand for swipes to rise at the end of each quarter. Expanding on the supply side, we also expect more meal-plan-equipped students to realize their daunting surplus of swipes towards a quarter’s end and so supply surges around this time as well. Are we right with our expectations? Let’s find out.
Number of Posts to Facebook Page by Day
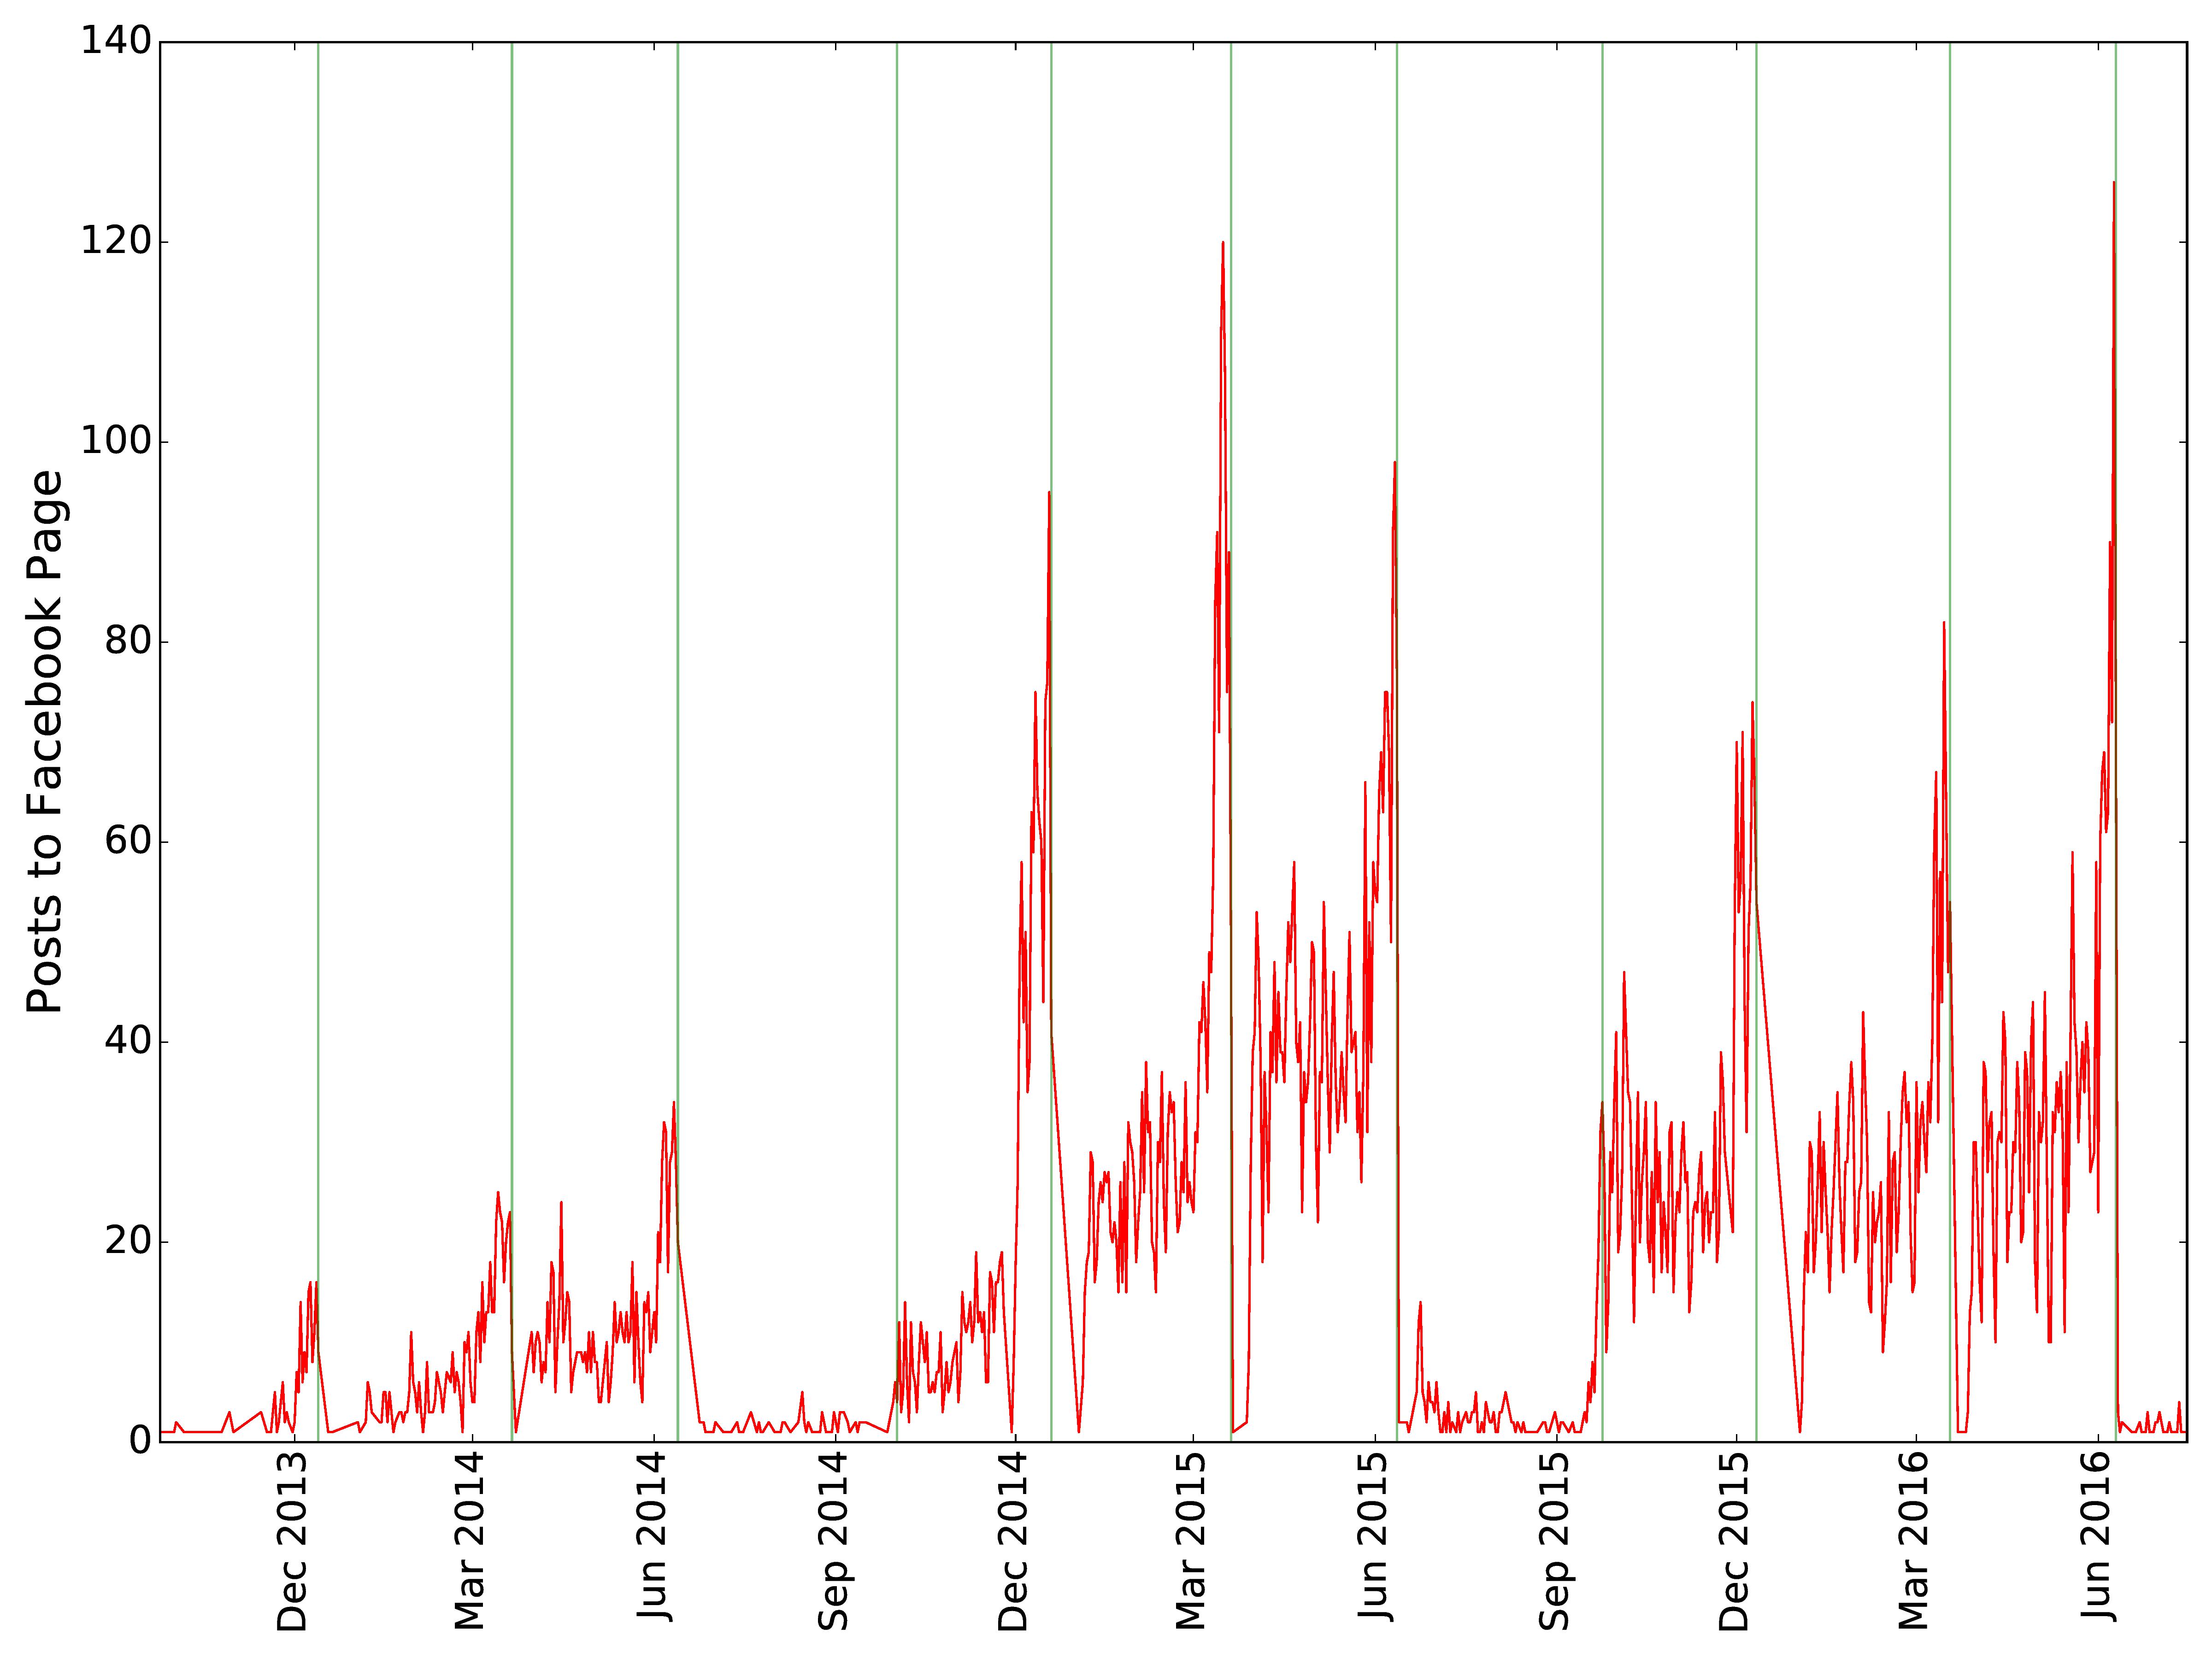
Indeed our predictions were right! The green vertical lines indicate the end of each academic quarter and are indeed the natural stopping points for upward trends in the graph. We see that the 2014 - 2015 academic year saw a huge growth in the swipe market with a potential decline in the 2015 - 2016 academic year.
Where are buyers eating?
One often cited problem with schools that use the swipe system for meals is that a swipe at one dining location will buy a completely different dining experience than a swipe at another dining location. For example, one swipe at the popular quick service restaurant Bruin Cafe will can buy a carton of Thrifty ice cream, which I can pick up for $2.50, at my local RiteAid. One swipe will also get me access to an all-you-can-eat dining hall such as De Neve, where I can indulge in college student (not so) guilty pleasure food such as pizza, burgers, fries, and as much ice cream as my heart desires, valued at $14.50 for non-meal-plan-carrying folk.
Also, given the choice between paying UCLA Dining $14.50 for an all-you-can-eat experience and paying $5 to a freshman who grossly miscalculated how many swipes she would need this quarter, it is evident what students are choosing. We thus expect the high-value dining halls, Covel (CO), De Neve (DN), Bruin Plate (BP), and Feast (FE) to dominate the locations which swipe buyers frequent. The three quick service restaurants, Rendezvous (RN), Cafe 1919 (19), and Bruin Cafe (BC) should make up a very small fraction of the swipe market.
Demand for UCLA Restaurants
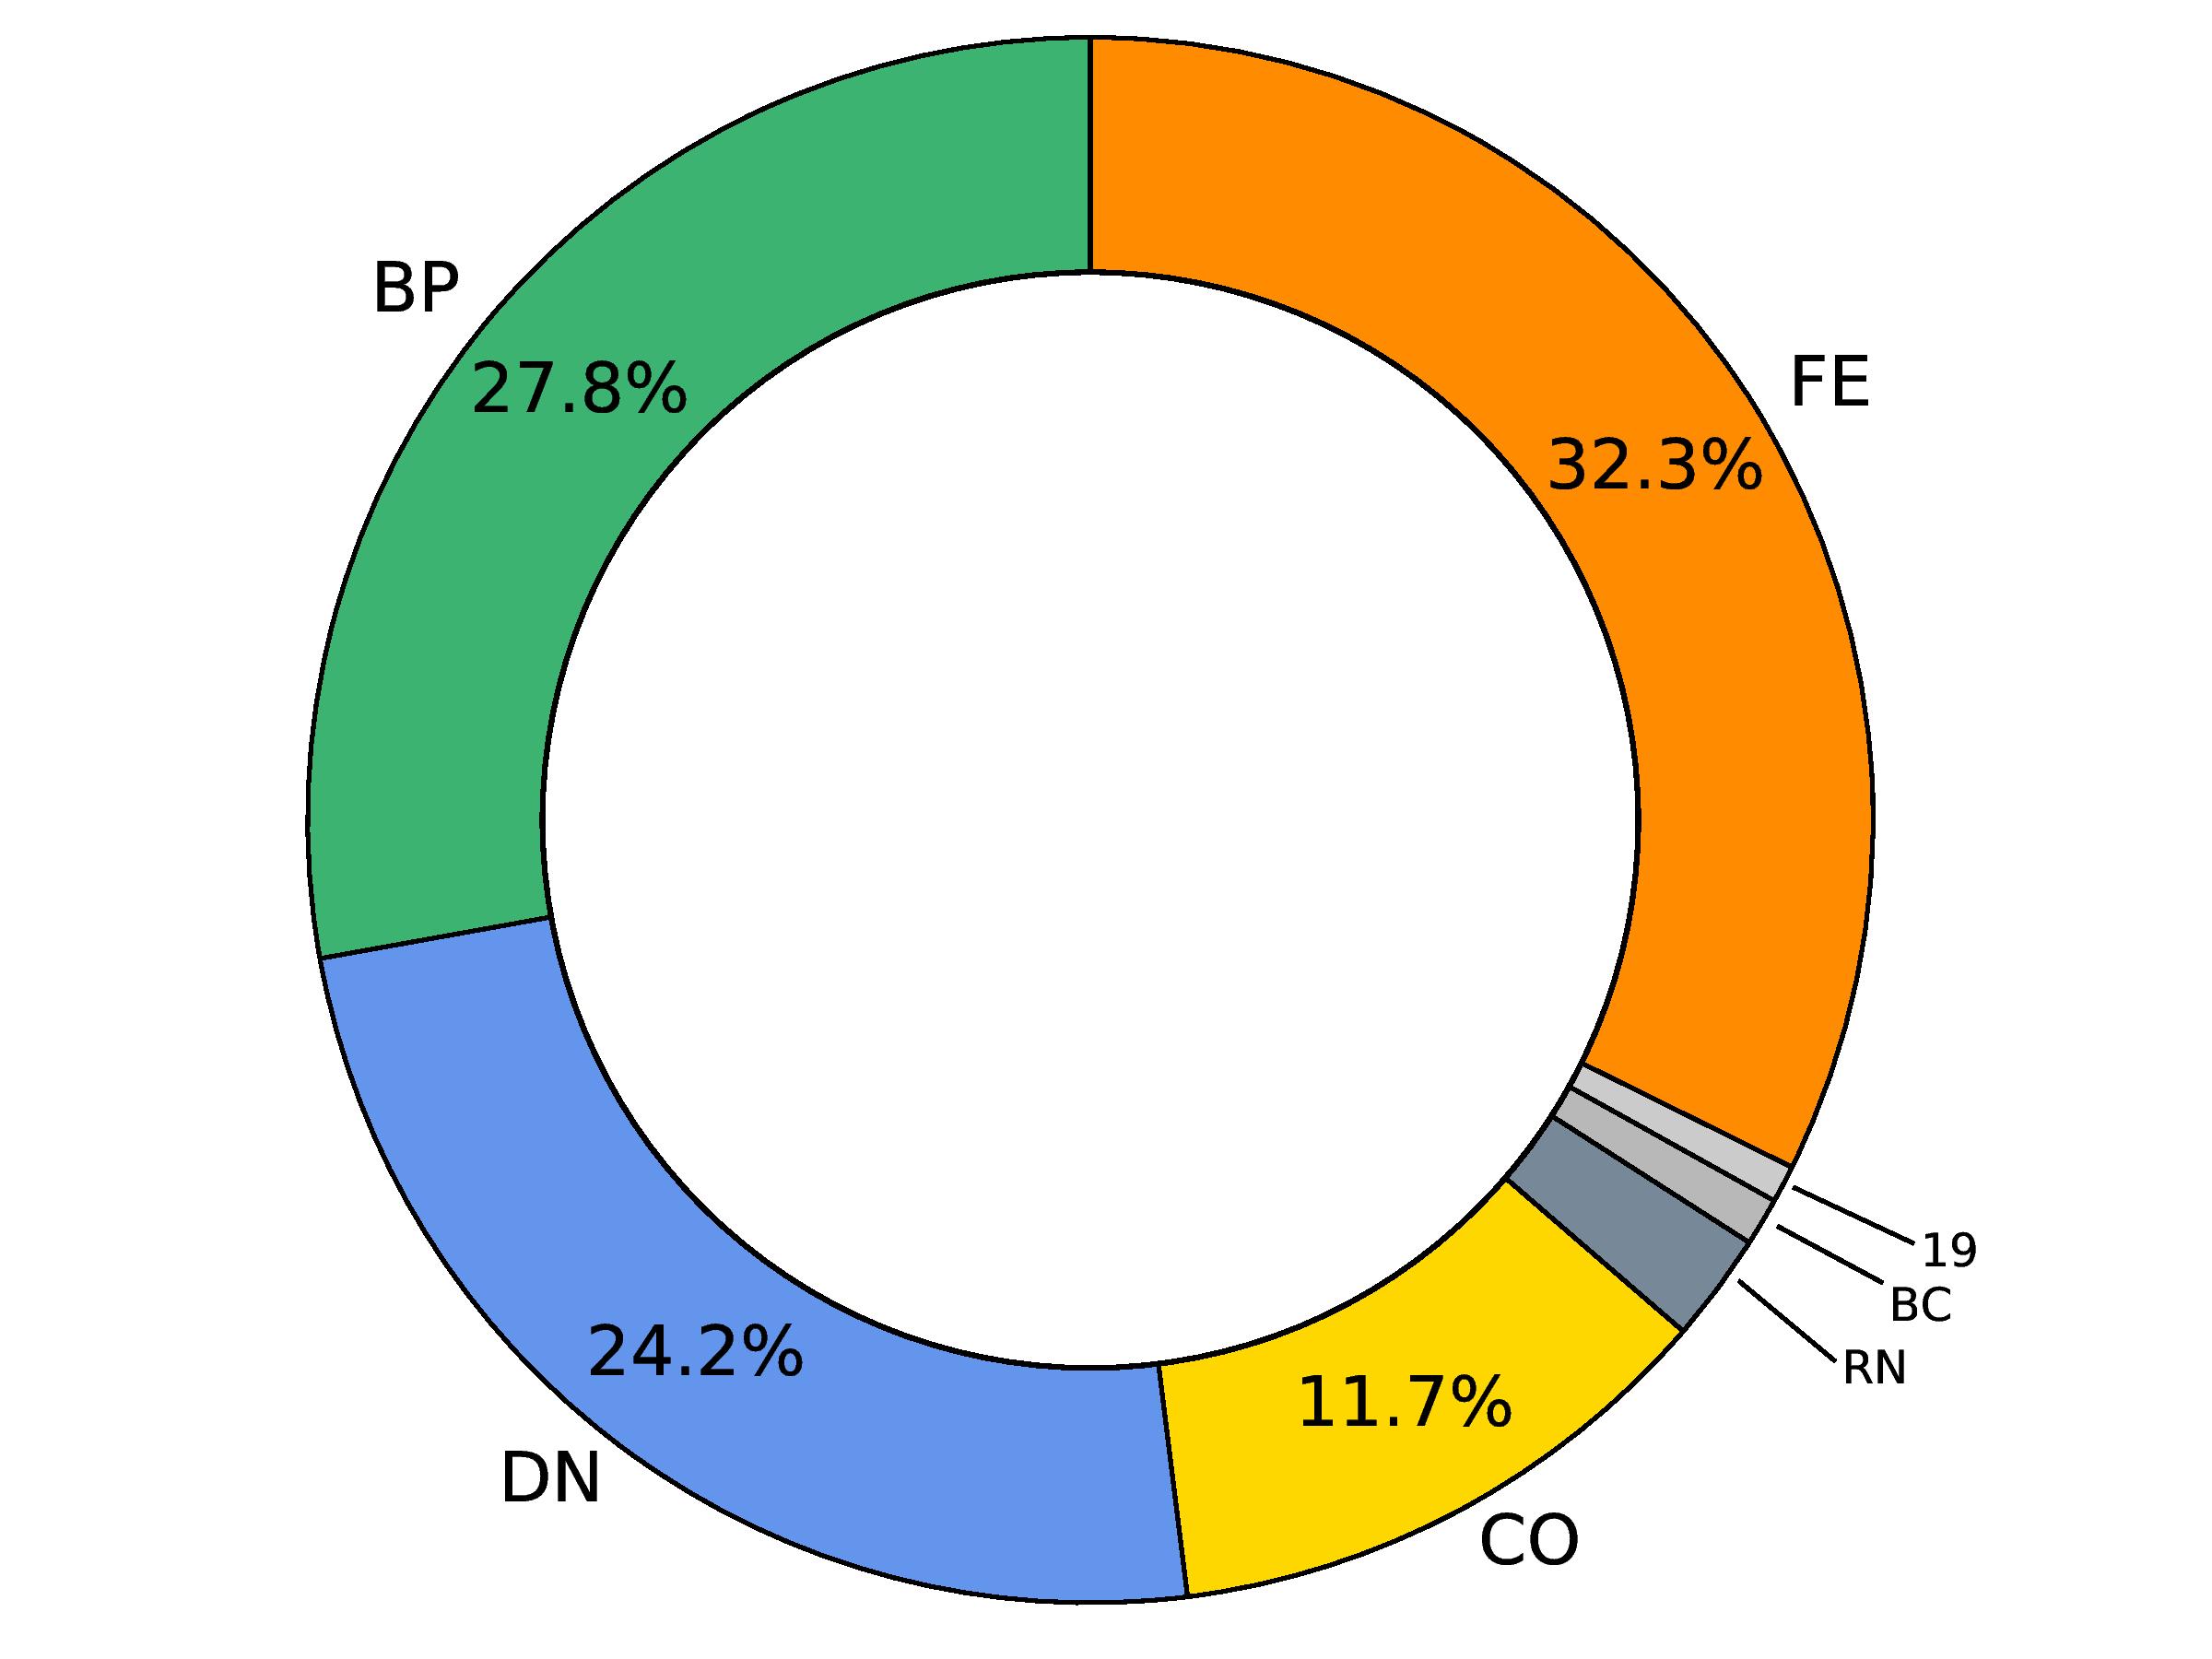
From the chart, we see that altogether the three quick service restaurants, where the dollar value of a swipe is relatively low, are frequented only 4% of the time. The Big 4 Dining Halls make up the overwhelming majority of the locations in the market for swipes. Feast (Asian Cuisine) is frequented most often, then Bruin Plate (Healthy Food), followed by De Neve (Tasty Junk Food), with Covel (In this author’s opinion, improving) coming in last.
How much does UCLA Dining lose?
As with many black markets (illegal music, pirated DVDs, etc.) the original creator of the product never sees revenue from underground transactions. The natural question is then: how much revenue does UCLA Dining lose from the operation of the swipe market?
Better yet, let’s think about lost revenue as a function of time. We know that in times between quarters, winter, spring, and summer breaks, there are fewer transactions taking place and thus there is less revenue being lost. But, we also know that around the end of academic quarters, especially in finals week, we see a surge of trades in the market, and should thus expect to see a surge of lost revenue. But, then again, maybe not … maybe students who are buying swipes at the end of quarters are mostly buying swipes to quick service restaurants because it takes up less valuable study/sleep time during finals week. If that is the case, we might not see a surge in lost revenue around finals week.
To answer the question we will focus only on people who buy swipes to dining halls (the Big 4 in the donut plot above) and use the following pricing information provided by UCLA dining:
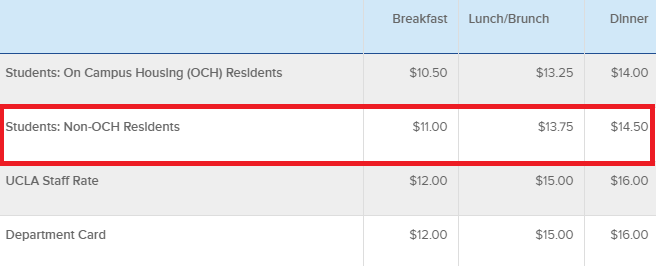
We use the prices for Non-OCH (On Campus Housing) Residents since these are the consumers that comprise the bulk of the market.
Let’s see what our data says:
Lost Revenue Over Time
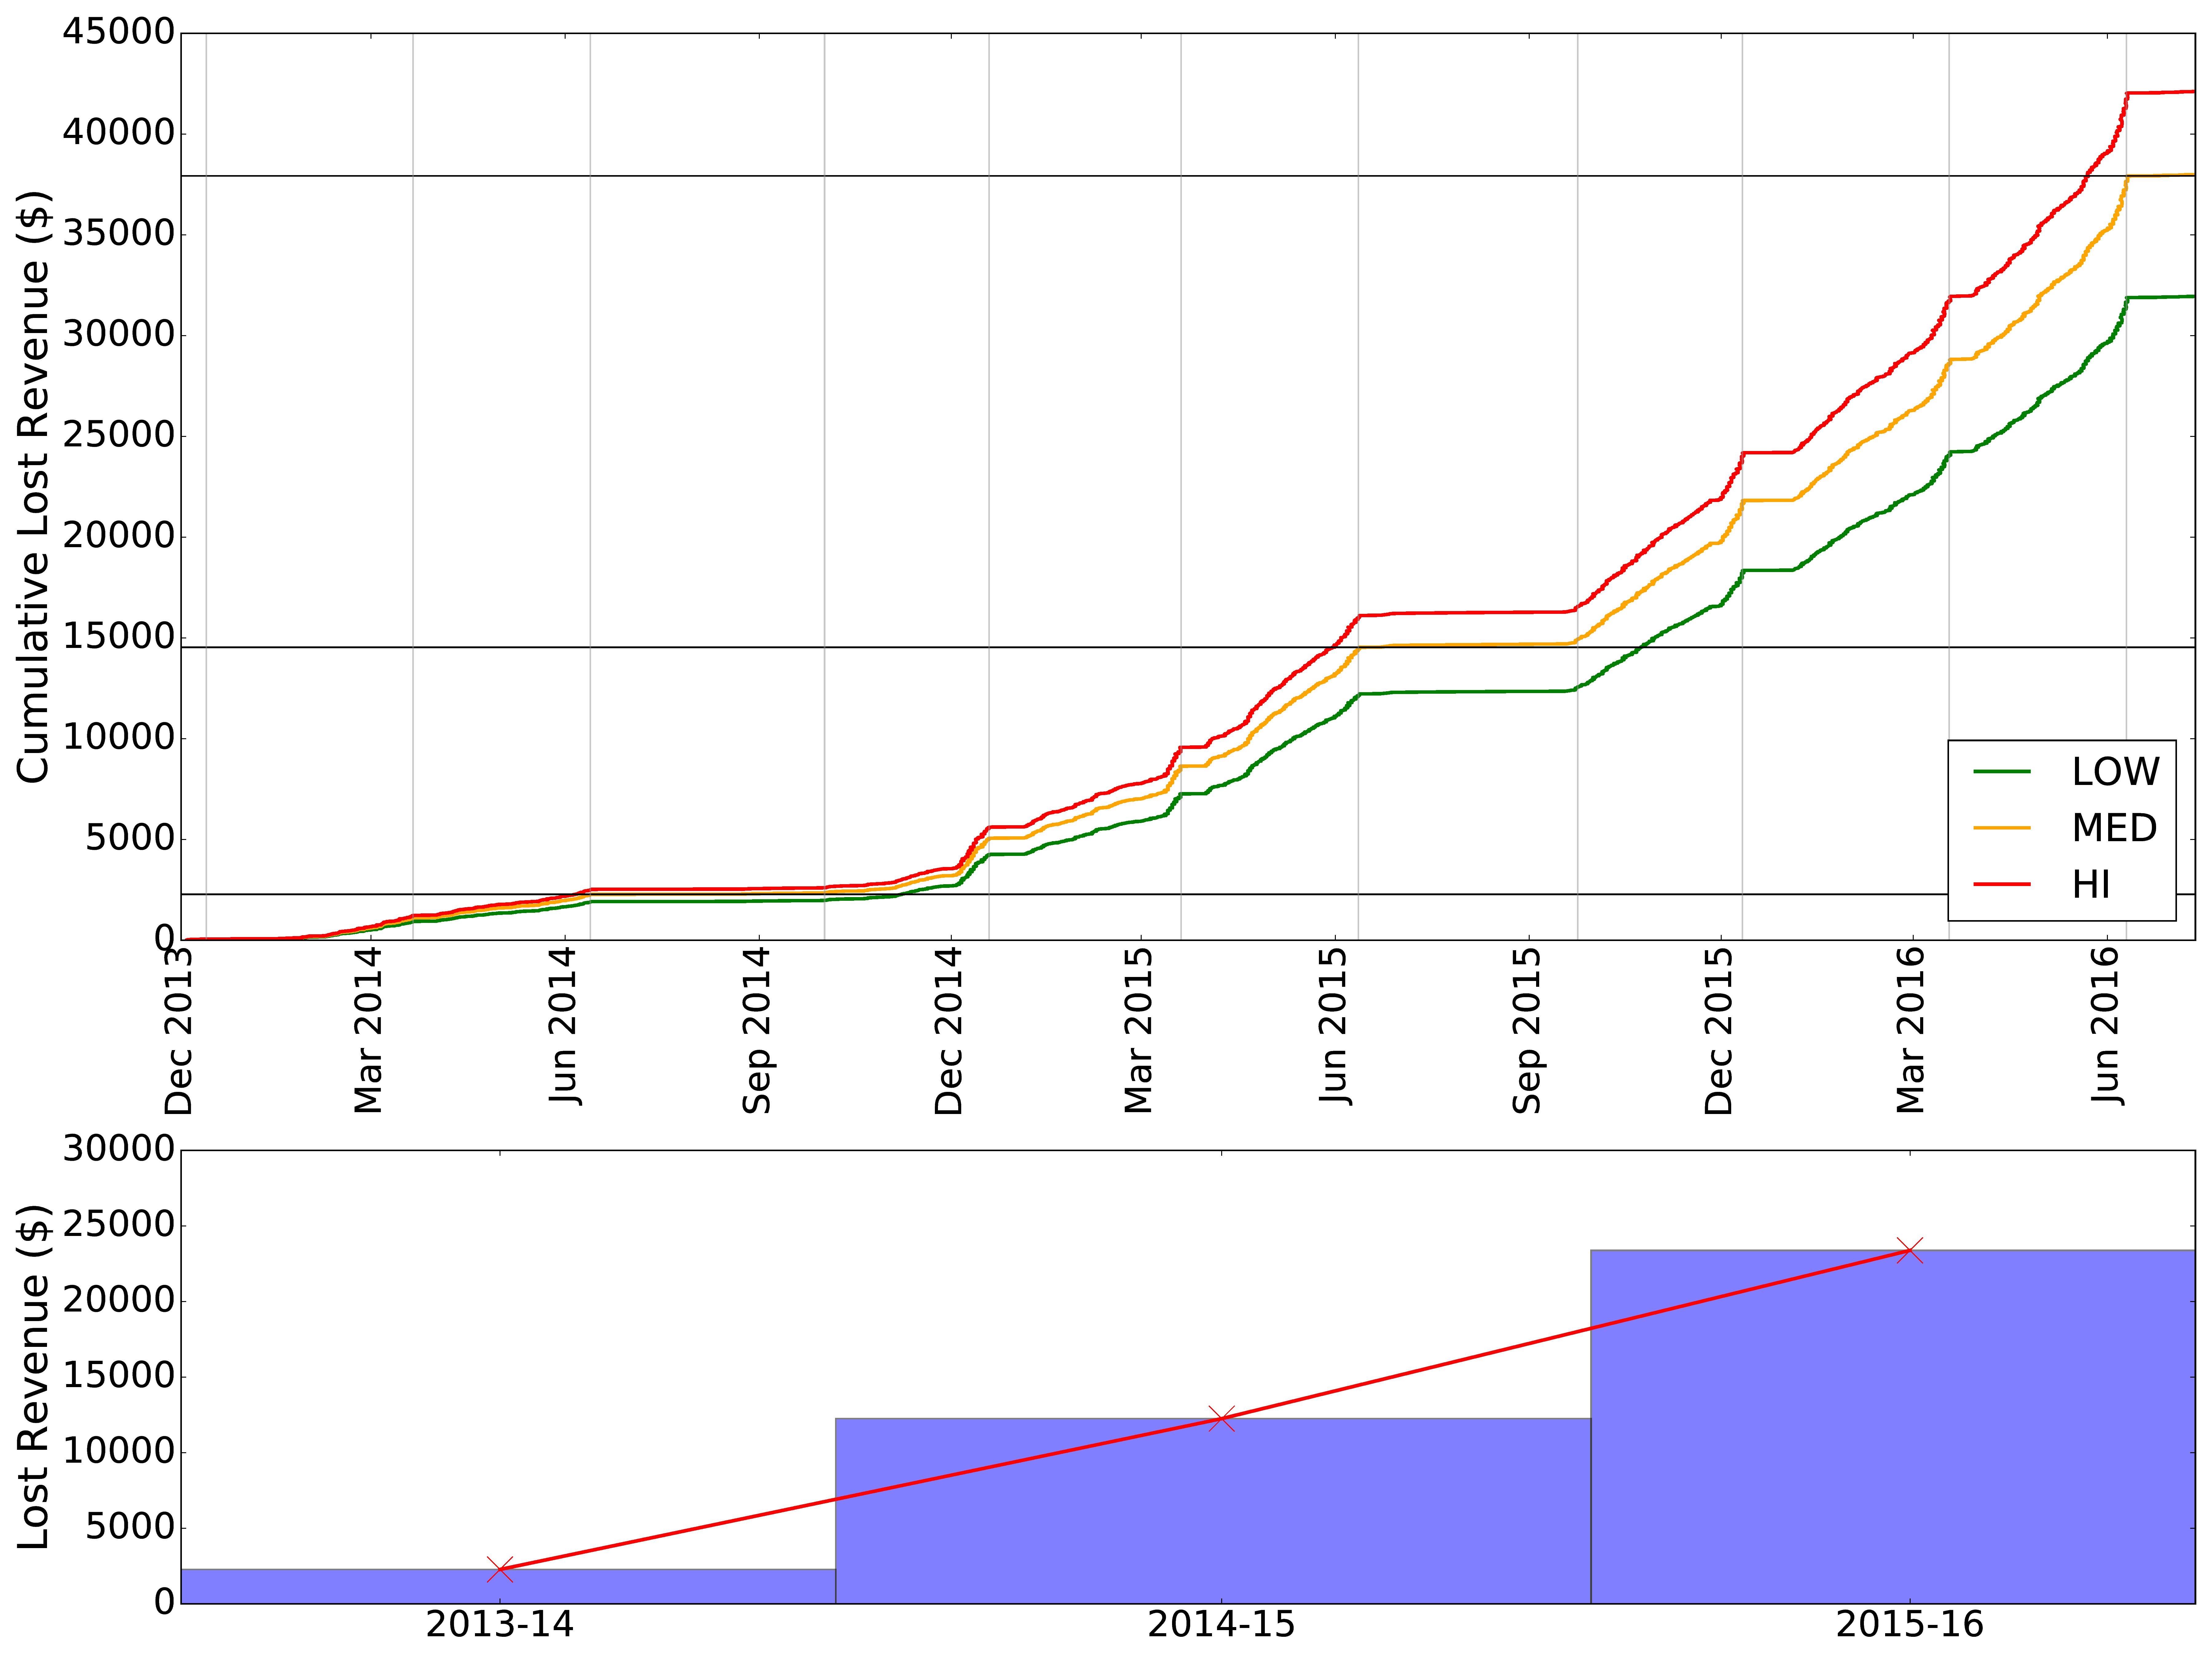
The upper plot shows three estimates: Low, Middle, and High. The Low estimate is the lost revenue if all the people in the data who bought Dining Hall swipes bought breakfast swipes, which have the cheapest value at $11.00 each. This is clearly not close to accurate. The green High estimate is the lost revenue if all the people in the data who bought Dining Hall swipes bought dinner swipes, valued at $14.50 each, which is also not realistic but likely more realistic than the Low estimate case. The yellow curve is the Middle estimate, based on the average price of a Breakfast, Lunch, and Dinner swipe ($13.08).
We see that indeed lost revenues stagnate in the breaks between academic quarters but also rise sharply in finals week, as we predicted.
Looking at the bottom chart, we see that lost revenue per academic year is also on the rise, rising in a roughly linear fashion.
The exact values of average lost revenue by year are:
- $2276 for the 2013-14 Year
- $12256 for the 2014-15 Year
- $23567 for the 2015 - 16 Year
If lost revenues continue to follow this pattern, a naive, back-of-the-envelope estimate says that UCLA Dining should expect to lose $36209 worth of potential revenues in the 2016-17 Year.
How much is a swipe worth throughout the year?
Let’s drill deeper into the data. If we extract price and quantity information from the posts, we can get how many swipes each author is trying to buy/sell and at what price.
Let’s define some basic terminology.
- Bid Price for a swipe: How much a buyer would pay for a swipe
- Ask Price for a swipe: How much a seller wants for a swipe
Something very interesting happens when we plot the average Bid and Ask prices for each day in the three academic years we have data for. Let’s see.
2013 - 2014 Year
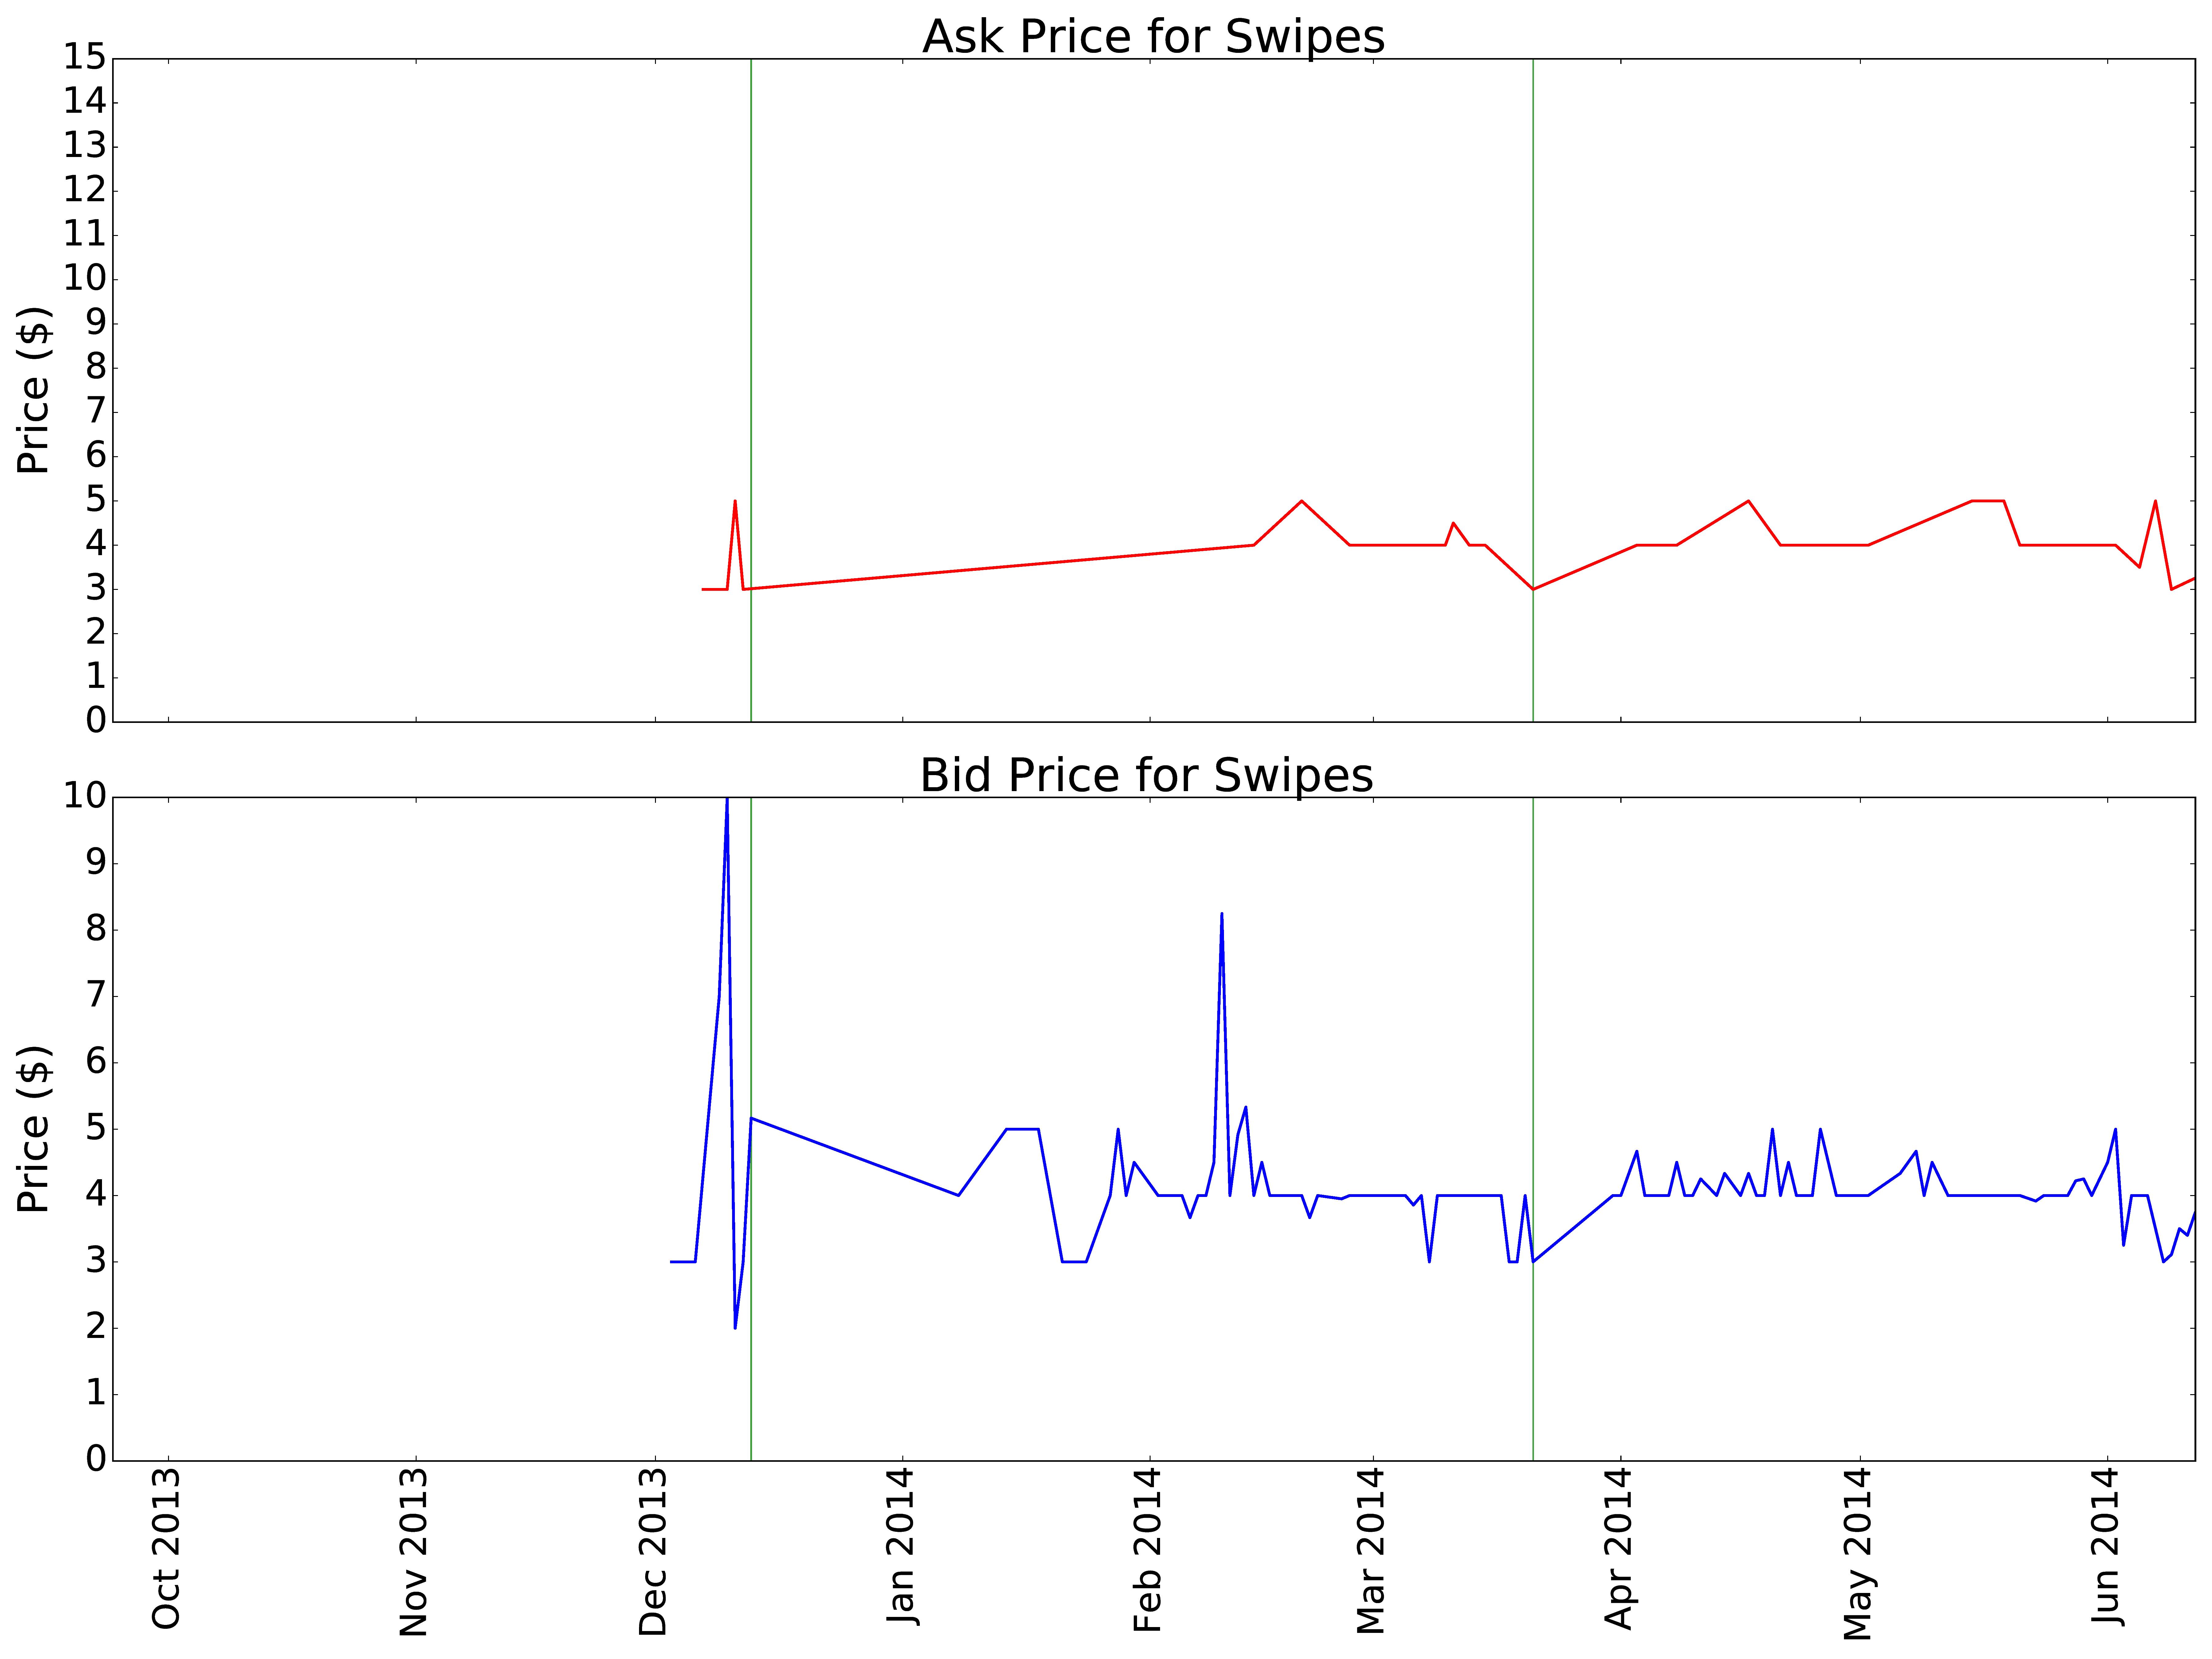
This is a pretty boring graph. First off, this market for swipes started in December 2013 so we have no data for the preceding Fall Quarter. Second, the ask prices seems to be relatively stable around $4 while the bid price is more volatile but still somewhat stable around $4 as well. At the least, this indicates that in the early stages of this market, while there wasn’t much interesting stuff going on, it seems buyers and sellers seemed to more or less agree on a $4 swipe.
2014 - 2015 Year
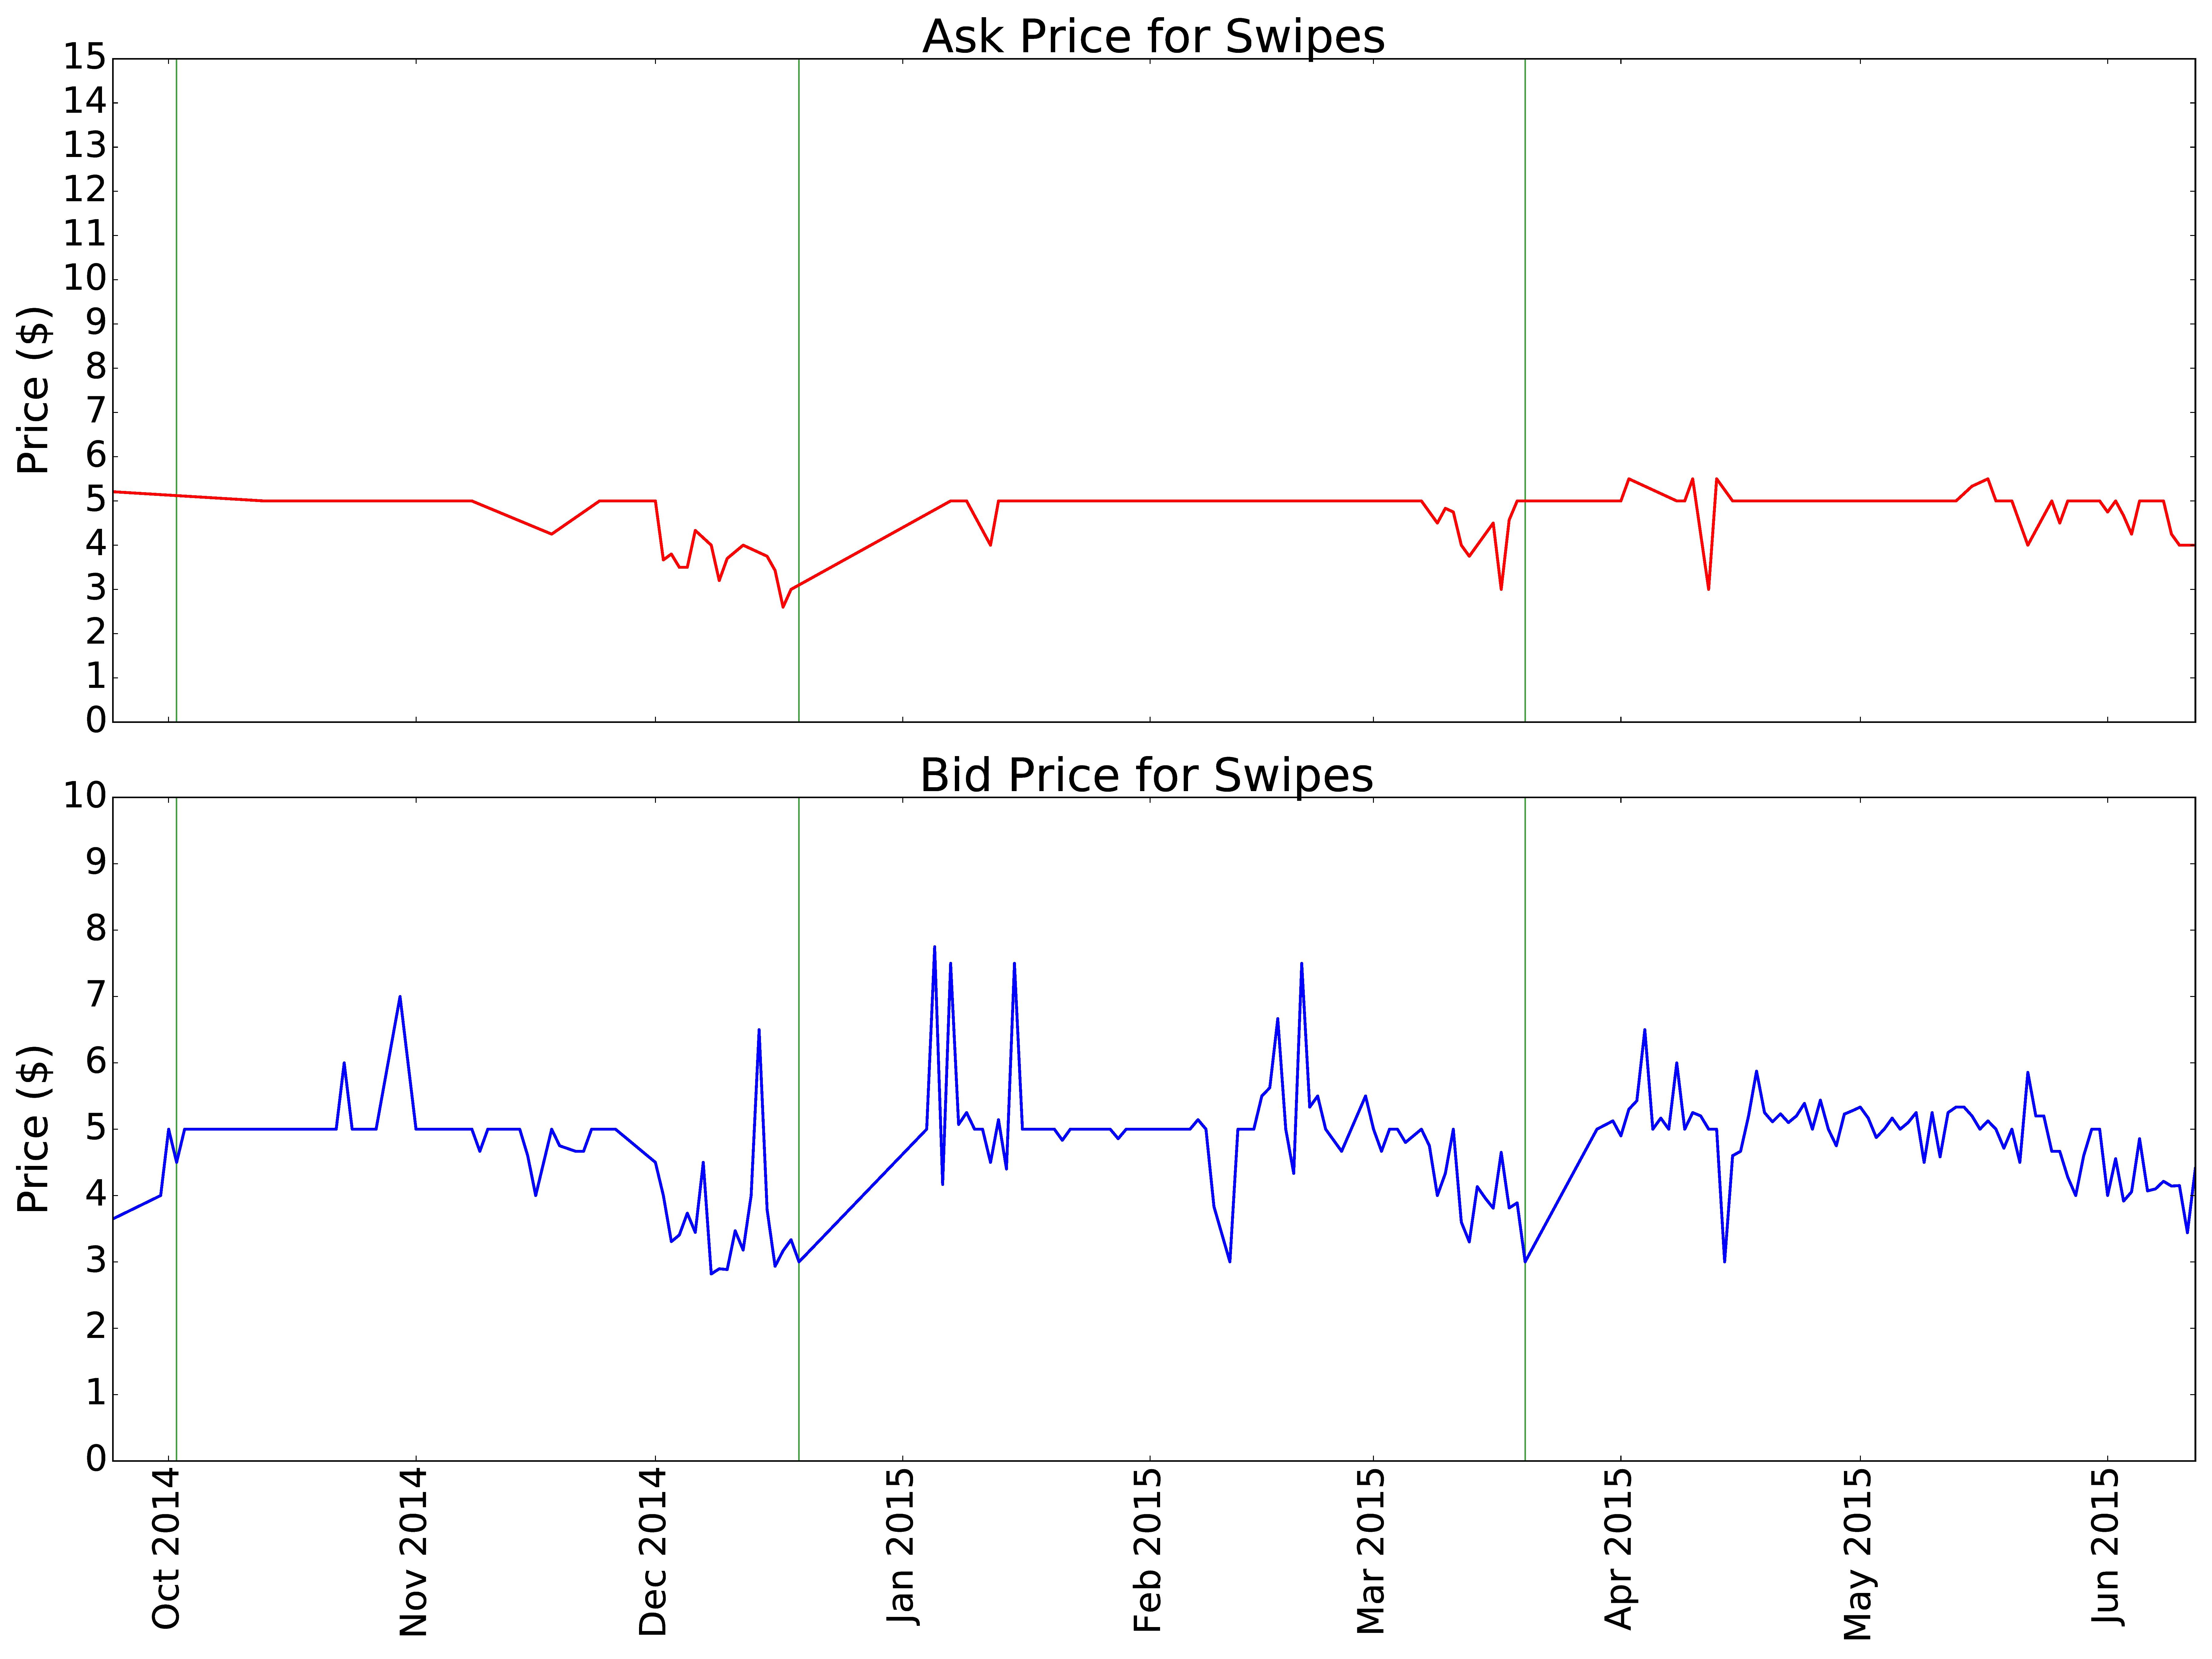
A market rises! The 2014 - 2015 year seems to be the transition period between the rudimentary bartering system of 2013-14 and the full blown market we will see in 2015-16. Perhaps the biggest change in the 2014-15 year is the rise in both ask and bid price from around $4 to $5. Swipes just got more expensive.
Also, while the ask prices are still pretty rigid over time, with sporadic diversions from the mean, we clearly see the bid prices adopting an intricate pattern. Indeed, by the Spring 2015 quarter (Late March to Early June), we see key patterns emerging in the market, one of which is the decline in bid price at a quarter’s end.
2015 - 2016 Year
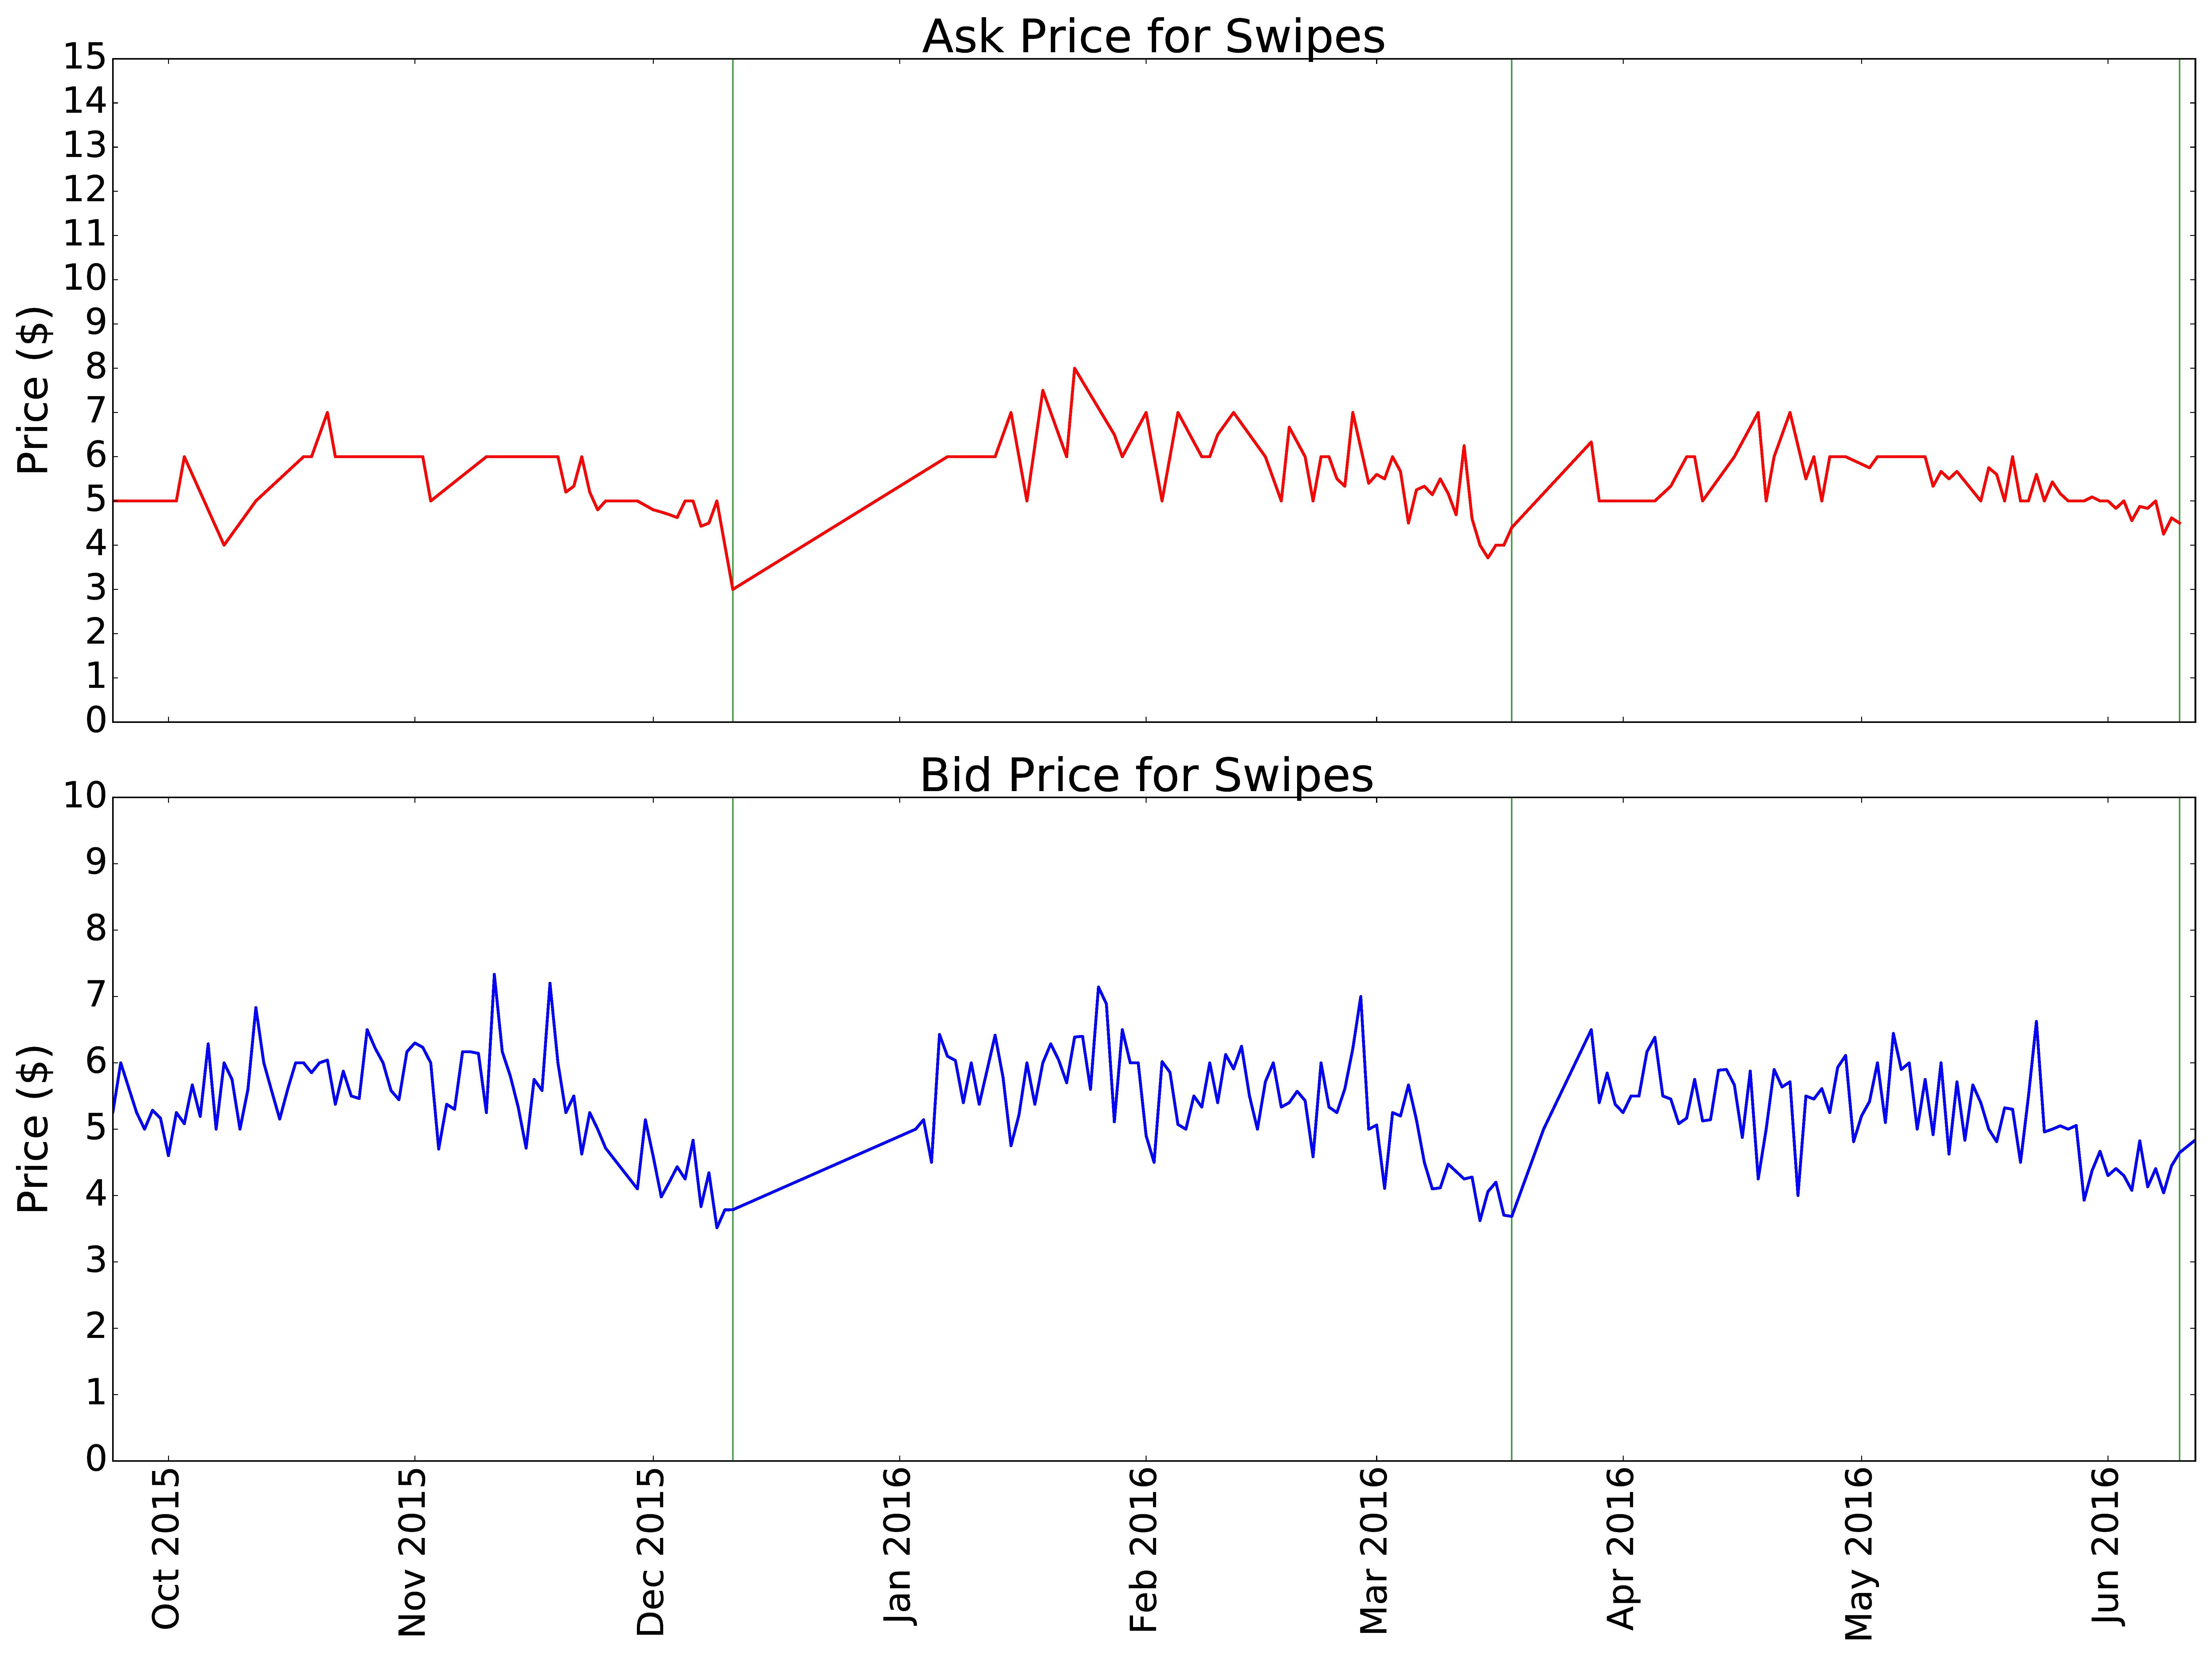
Before we get into all the intricacies in the 2015-16 swipe market, let’s note that while the bid price continues to hover around $5, the ask price has actually started to hover around a slightly higher value, something like $5.50. It seems sellers are demanding more for their precious swipes while buyers are not willing to meet that higher price.
This 2015-16 graph really shows us key dynamics in the market. The key feature here is the apparent fall in both bid and ask prices in the last week of each quarter. But what does this really mean? Quick Econ 101 lesson:
- When there is a positive shock to supply, such as at the end of a quarter when students flood the market with unused swipes, price should drop
- When there is a positive shock to demand, such as at the end of a quarter when students need quick, cheap food amidst studying for final exams, price should rise
Since price falls at the end of each quarter in the 2015-16 year, we know that the supply effect beats the demand effect. In more basic terms, the market is flooded with extra swipes quicker than consumers can buy those swipes.
Market Friction
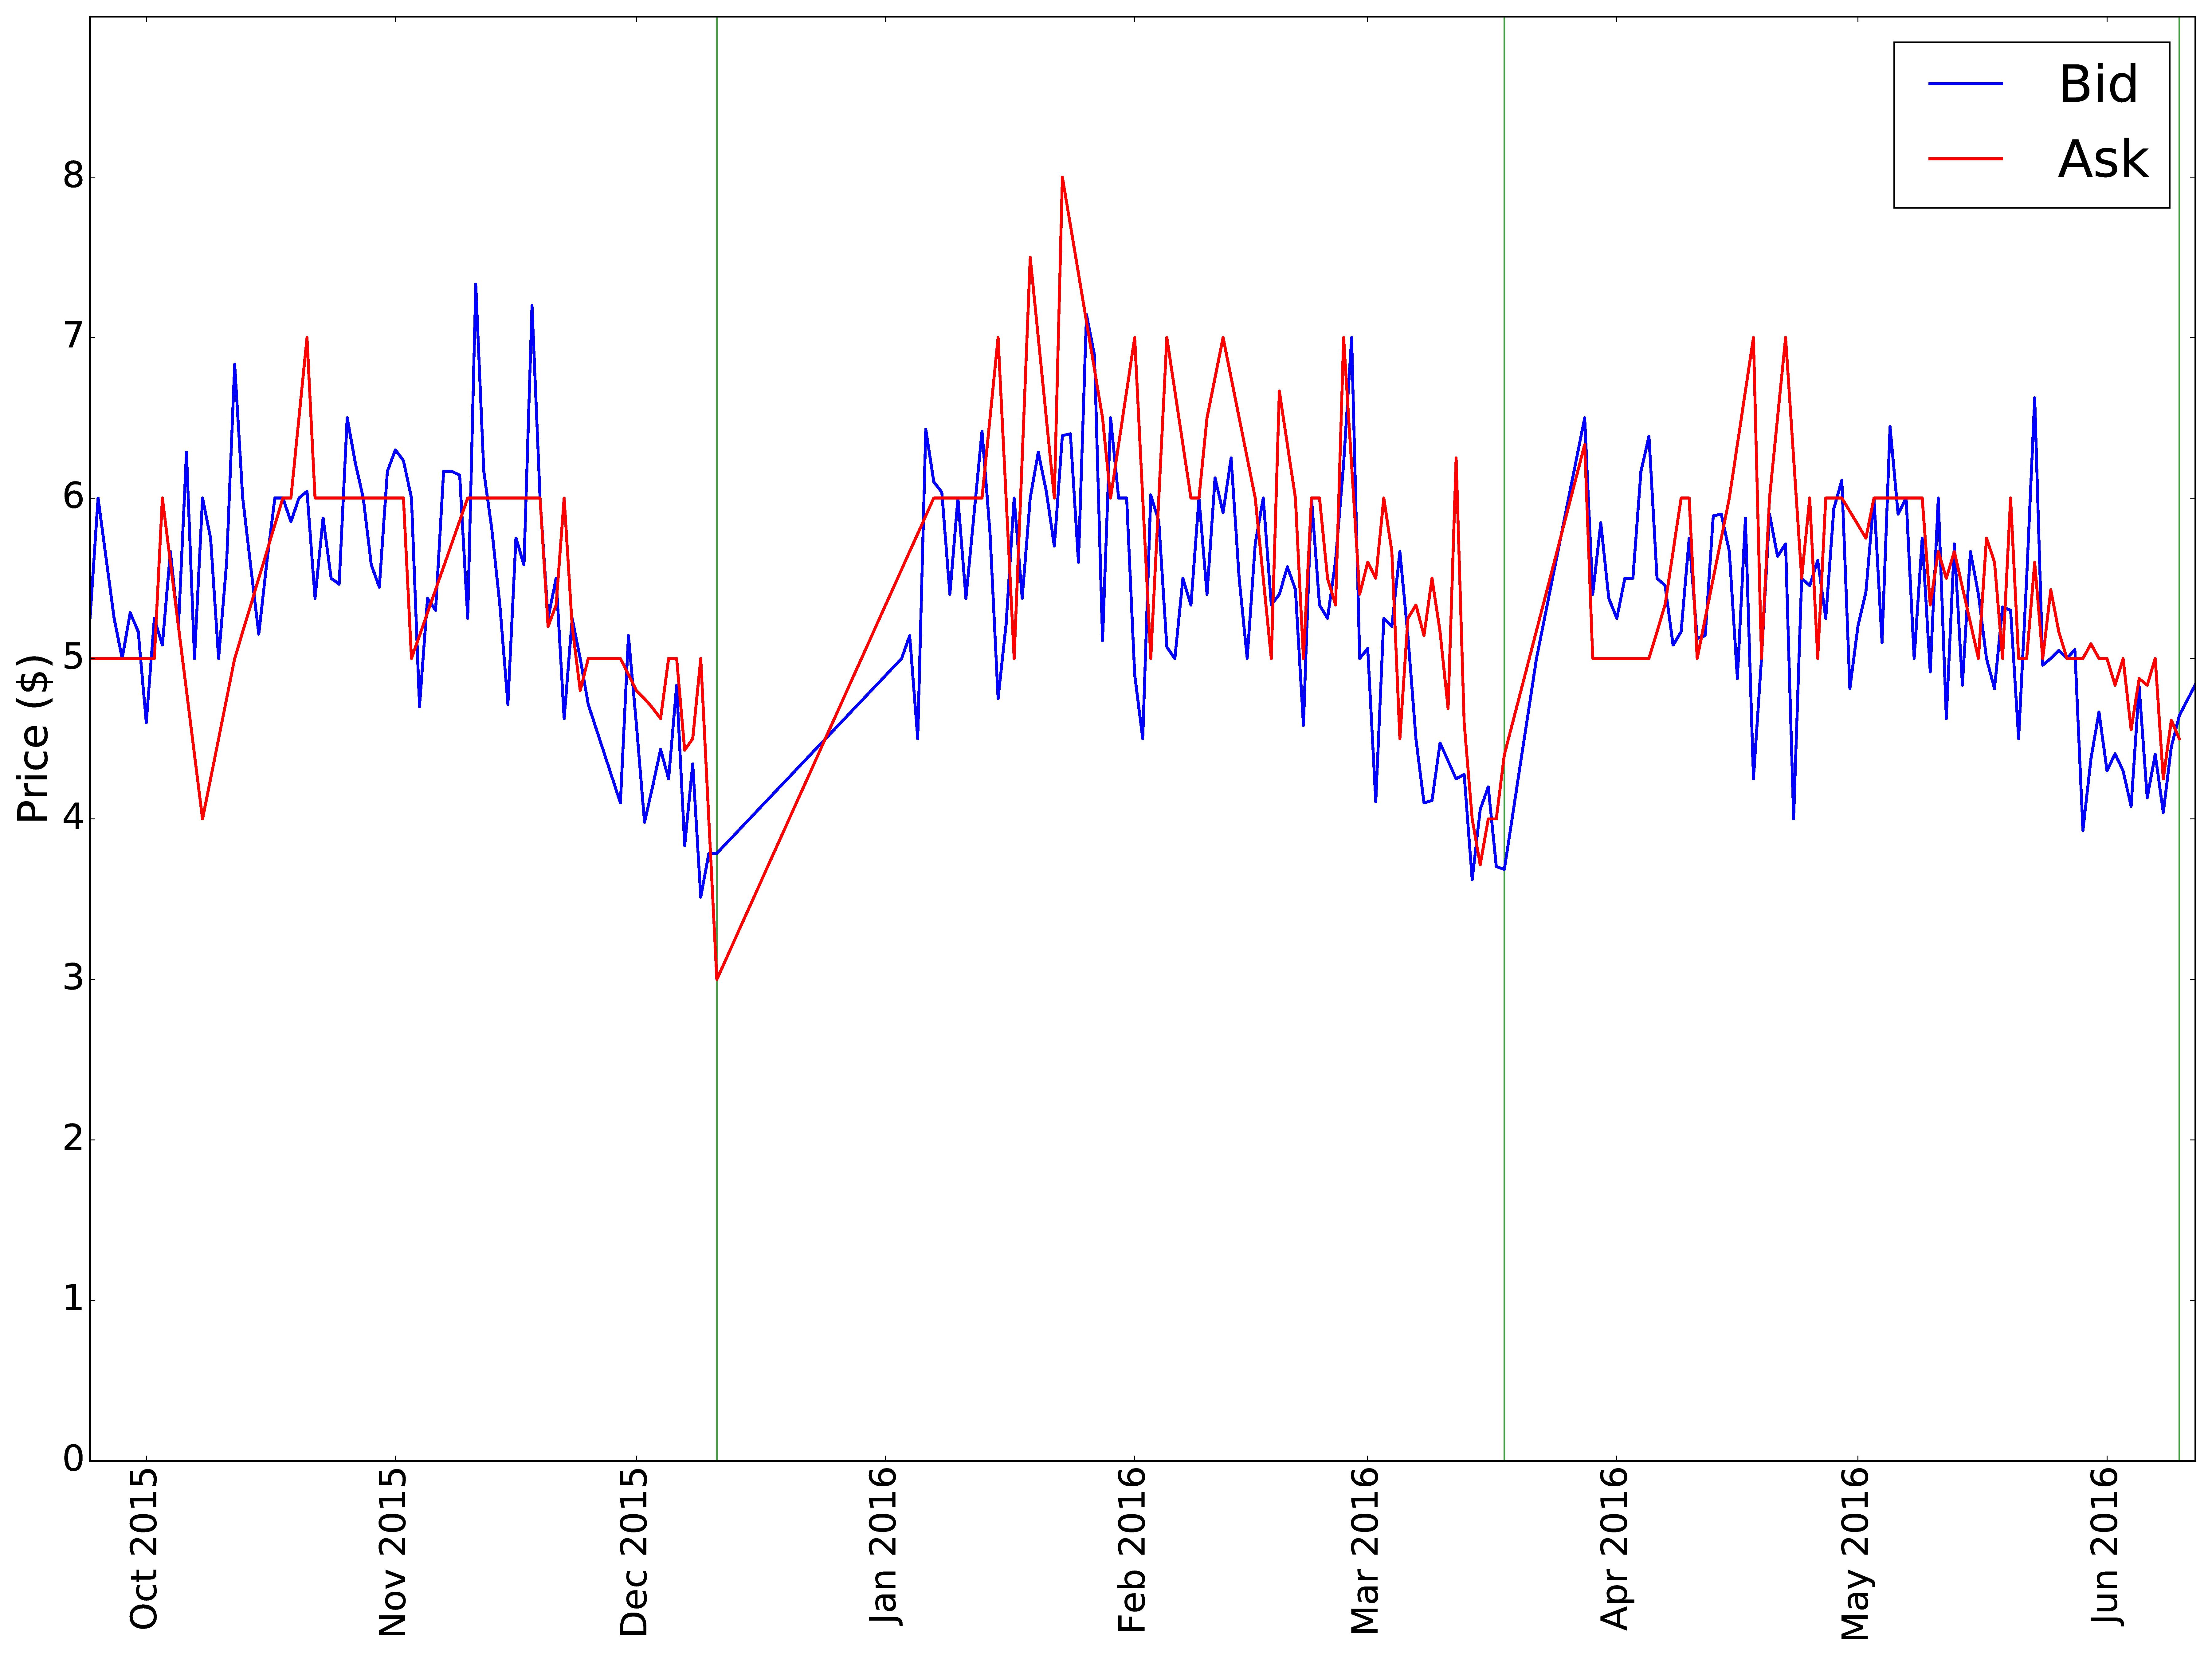
Taking a look at ask and bid prices overlaid above, we see that although both price curves follow roughly the same pattern over time, the red ask price curve is usually above the blue bid price curve. This results in a condition called “market friction” where swipes are not able to be traded at the given ask and bid prices.
Basically, if I, as a buyer, want to buy a $5 swipe but sellers at the time are only selling $6 swipes, it will likely take a greater time cost to both parties to negotiate the deal or perhaps the deal will fail altogether.
How fluid is the market on different days of the week?
Maybe it’s the case that market friction is only an issue on certain days of the week or maybe it’s a persistent problem across the board. Let’s turn to the data.
Mean Price per Day and Median Posts per Day (2015 - 2016 Year)
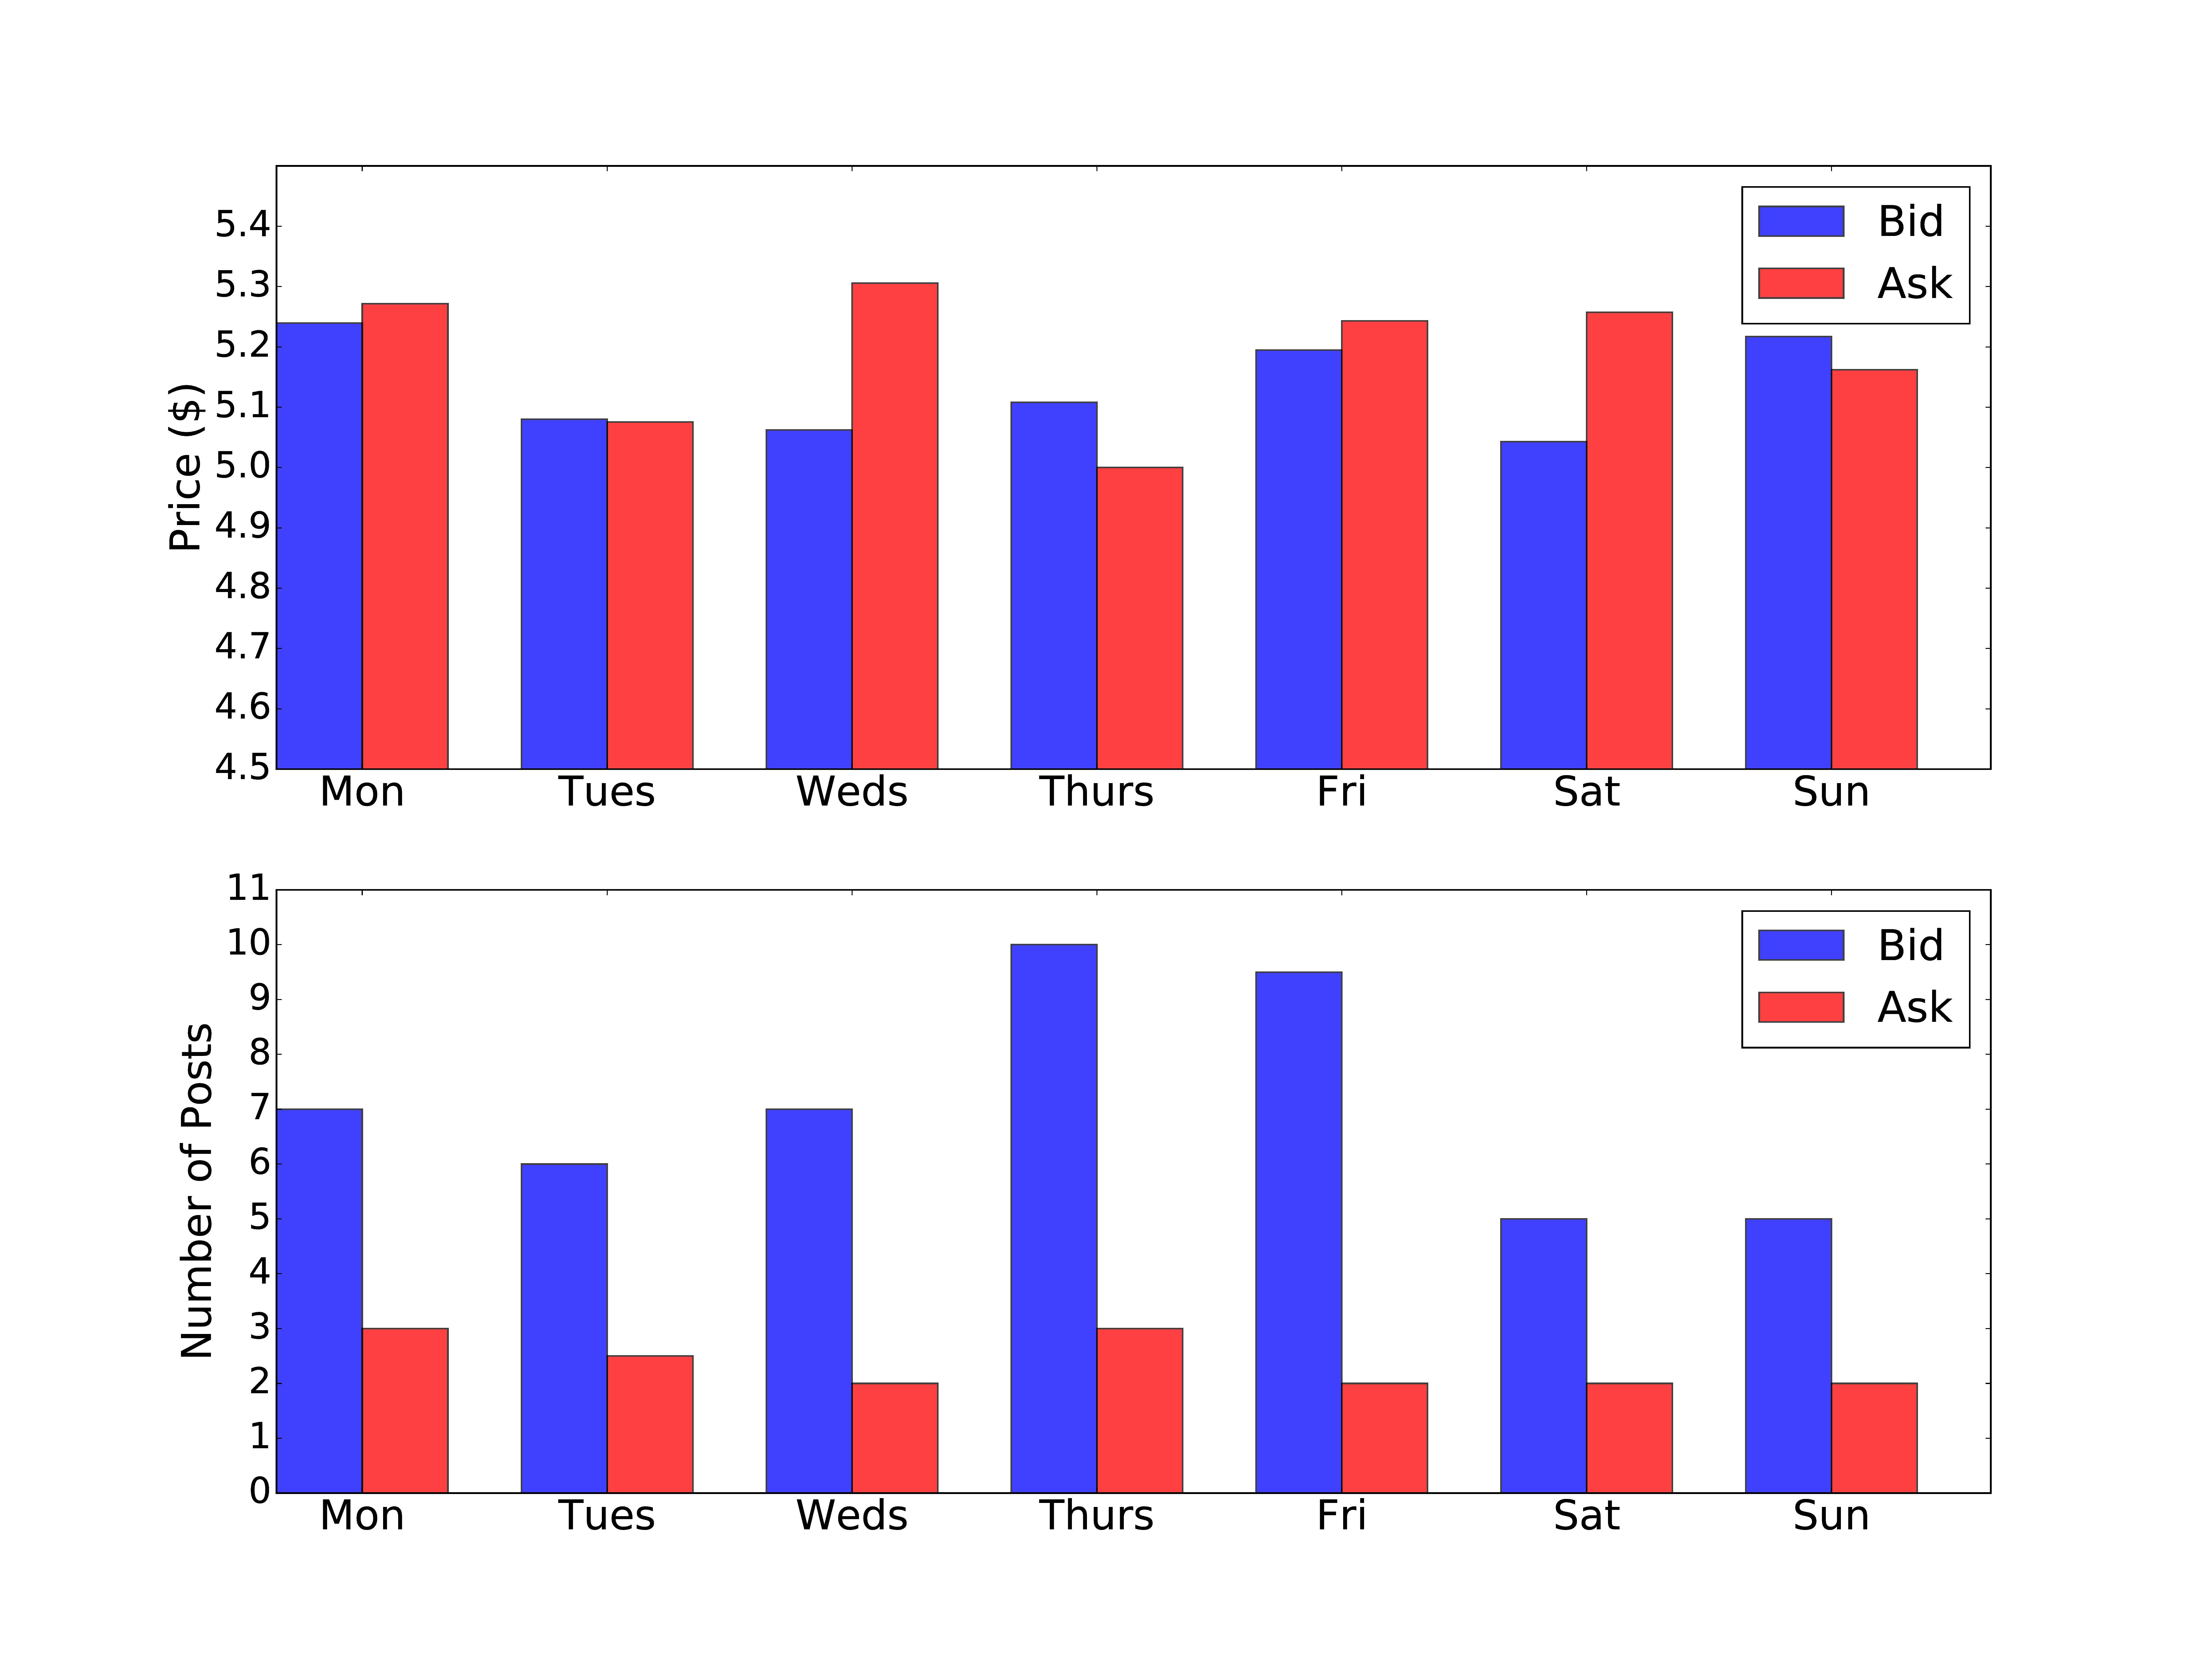
Remember that when ask price exceeds bid price, we have market friction. This seems to be the case on Monday, Wednesday, Friday, and Saturday on average. The opposite case, when ask price is lower than bid price, is favorable for the fluidity of the market and occurs on Tuesday, Thursday, and Sunday on average. The follow up question is then: When are there the most bid and ask posts to the Facebook page? It turns out, looking at the lower bars, that Thursday and Friday have very high median posts per day for buyers and a moderate median posts per day for sellers.
It’s interesting that one of these days is often prone to market friction while the other is not.
So What?
The black market for swipes is, in the end, driven by the same supply and demand economics that govern all markets for goods. As we have seen, this market is leading to larger and larger lost revenues for UCLA and is potentially drifting towards market friction issues. This author proposes two possible remedies, one targeting supply and one demand, which seek to weaken this black market and benefit the consumer, supplier, and establishment. Consequences of either remedy will be discussed.
Plan 1: Shock Supply
The reason there is great supply in the market for swipes is that premier-meal-plan-equipped students often find themselves at the end of a quarter with more swipes than they can use. They immediately try and cut their losses by selling swipes to those who are willing to buy them. The reason this panic occurs at the end of each quarter is that if the remaining swipes are not used, they will be erased.
This author proposes the following plan: Allow students to transfer some fraction of unused swipes from this quarter into next quarter.
Under the current regime, where there is a 0% transfer rate of remaining swipes from one quarter to the next, we get these massive supply shocks at the end of each quarter. Under a regime where there is a 100% transfer of remaining swipes from one quarter to the next, the panic might subside at the end of Fall and Winter quarter, since students know that their swipes will carry forward. But, there will likely be an enormous shock at the end of the academic year, when students have accumulated 3 quarters worth of swipes. This is not favorable either. Some compromise between 0% and 100% carryover may help to curb the end-of-quarter supply shocks and give students the freedom the data shows they need.
Plan 2: Shock Demand
On the other end of the spectrum are the off-campus students who buy swipes, especially in high demand periods such as finals week. These students choose to buy swipes because it is cheaper to do so than to purchase the same meal at often 3 to 4 times the price from UCLA Dining.
UCLA Dining does offer non-resident meal plans which give non On Campus Housing students the option to buy a meal plan for the quarter, but there is an issue with the pricing of these plans.
The prices for the upcoming 2016 Fall quarter were found on the UCLA Ask Housing website and are reproduced below:
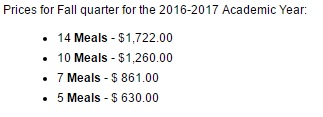
Let’s break each plan down:
- $1722 / (14 meals per week * 11 weeks) = $11.18 / meal
- $1260 / (10 meals per week * 11 weeks) = $11.45 / meal
- $861 / (7 meals per week * 11 weeks) = $11.18 / meal
- $630 / (5 meals per week * 11 weeks) = $11.45 / meal
An off-campus student would much prefer to buy the proven $5 swipe than to buy swipes in bulk without receiving any reduction in unit price.
How much does an On Campus Housing resident pay per swipe? Since meal plans are included in housing prices, we need to control for housing style and tease out the underlying per unit meal cost.
- A single occupancy classic residence dorm room with a 14P meal plan costs $17,426.04 per year
- A single occupancy classic residence dorm room with a 19P meal plan costs $17,685.96 per year
The difference is $259.92 which is the cost of the difference between these two products, 5 completely flexible meals per week.
$259.92 / (5 meals per week * 11 weeks per quarter * 3 quarters) = $1.58 / meal
No wonder On Campus Housing students are comfortable selling their meals for $5, they are actually making a nice $3.42 profit per swipe!
This author proposes the following plan: Lower off-campus student meal plan rates
And this does not mean lowering them to $5, but just enough so that off-campus students start to viably consider the profitability of buying a long term guaranteed contract with UCLA Dining rather than have to scramble to find someone selling swipes last minute. The per unit premium above $5 would be the security premium associated with a guaranteed meal at any meal period during the day.
As it stands now, the $6+ premium above $5 that UCLA Dining charges per unit to off-campus students is clearly too high for many students to justify buying the meal plans. If the market for swipes for off-campus students is elastic (lowering price causes a large increase in demand) then the new consumers of the cheaper meal plans will actually lead to increased revenues for UCLA Dining while giving these students more affordable and secure access to meals.
A Combined Effect
Taken together, these shocks to supply and demand would cause quantity of swipes supplied on the UCLA swipes black market to decrease while giving on-campus students increased flexibility in their meal plans and giving off-campus students affordable access to on-campus meals.
Notes
- One key assumption in the lost revenue analysis was that all requests to buy swipes on the Facebook page were met with a seller for swipes. This is clearly not the case 100% of the time, but scrolling through the page, it is often the case. It is also the reason that this author included the low, medium, and high estimates of lost revenue.
- Much of the above analysis is dependent on a correct extraction of information from each post. Although this extraction can never be 100% accurate (if it were, we might have a revolution in NLP on our hands), this author has quality tested random samples of posts repeatedly and ironed out all bugs as they arose. The error rate is expected to be ~3%. All code and data used in this analysis will be available soon on my GitHub.
- UCLA Dining does an extremely good job at accommodating the On Campus Student body in all areas including providing a gluten free pantry, Halal and Kosher meals, a wide variety of vegetarian options, and diverse menus each and every day. This analysis is not meant to point fingers but rather to shed light on an issue and quantify it so that action can be taken for the benefit of all parties.
Thanks for reading and please leave comments!